Low-code platforms are now central to enterprise app development in 2026, but debugging them can be tricky. Since code is often hidden behind visual workflows, traditional debugging methods fall short. AI debugging tools solve this by providing detailed insights into data flows, error detection, and performance bottlenecks. They reduce debugging time by up to 80%, making them essential for enterprises and non-technical users alike.
Key highlights:
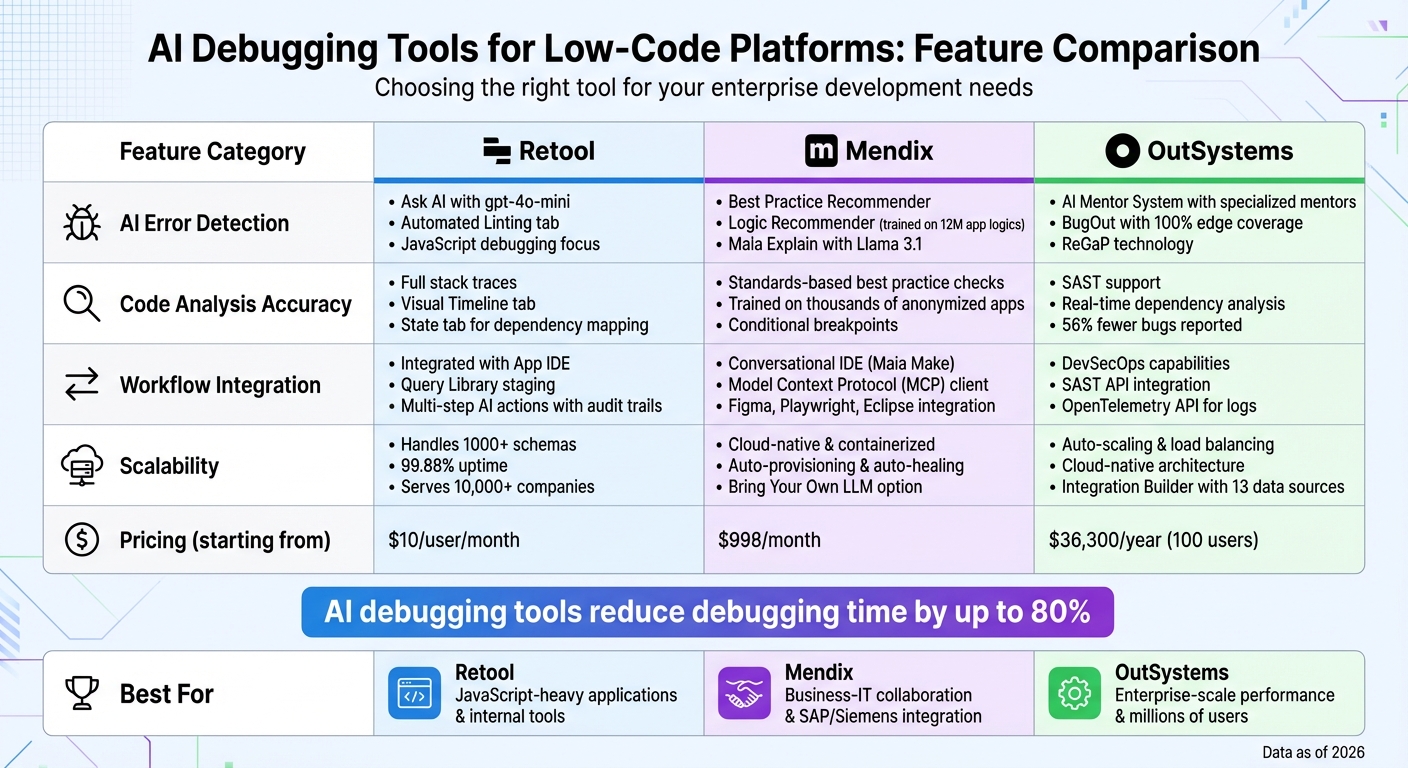
- Retool: Focuses on JavaScript-heavy debugging with tools like "Ask AI" for query fixes and error explanations.
- Mendix: Uses AI to auto-detect and resolve errors with tools like the Best Practice Recommender.
- OutSystems: Features an AI Mentor System for security, performance, and maintainability checks, along with real-time dependency analysis.
Each platform offers unique strengths in AI debugging, catering to different development needs. Many of these leaders are also featured in low code platform market insights regarding enterprise adoption. Below is a quick comparison:
| Platform | AI Error Detection | Code Analysis Accuracy | Workflow Integration | Scalability |
|---|---|---|---|---|
| Retool | AI for JavaScript debugging | Detailed visual tracing | Integrated with app IDE and workflows | Handles large-scale environments |
| Mendix | Auto-fixes logic errors | Standards-based best practice checks | Conversational IDE with AI assistance | Cloud-native and containerized |
| OutSystems | Specialized AI mentors | SAST and real-time analysis | Supports DevSecOps and external APIs | Auto-scaling and load balancing |
Choosing the right tool depends on your team's tech stack, scale, and debugging needs.
AI Debugging Tools Comparison: Retool vs Mendix vs OutSystems
1. Retool
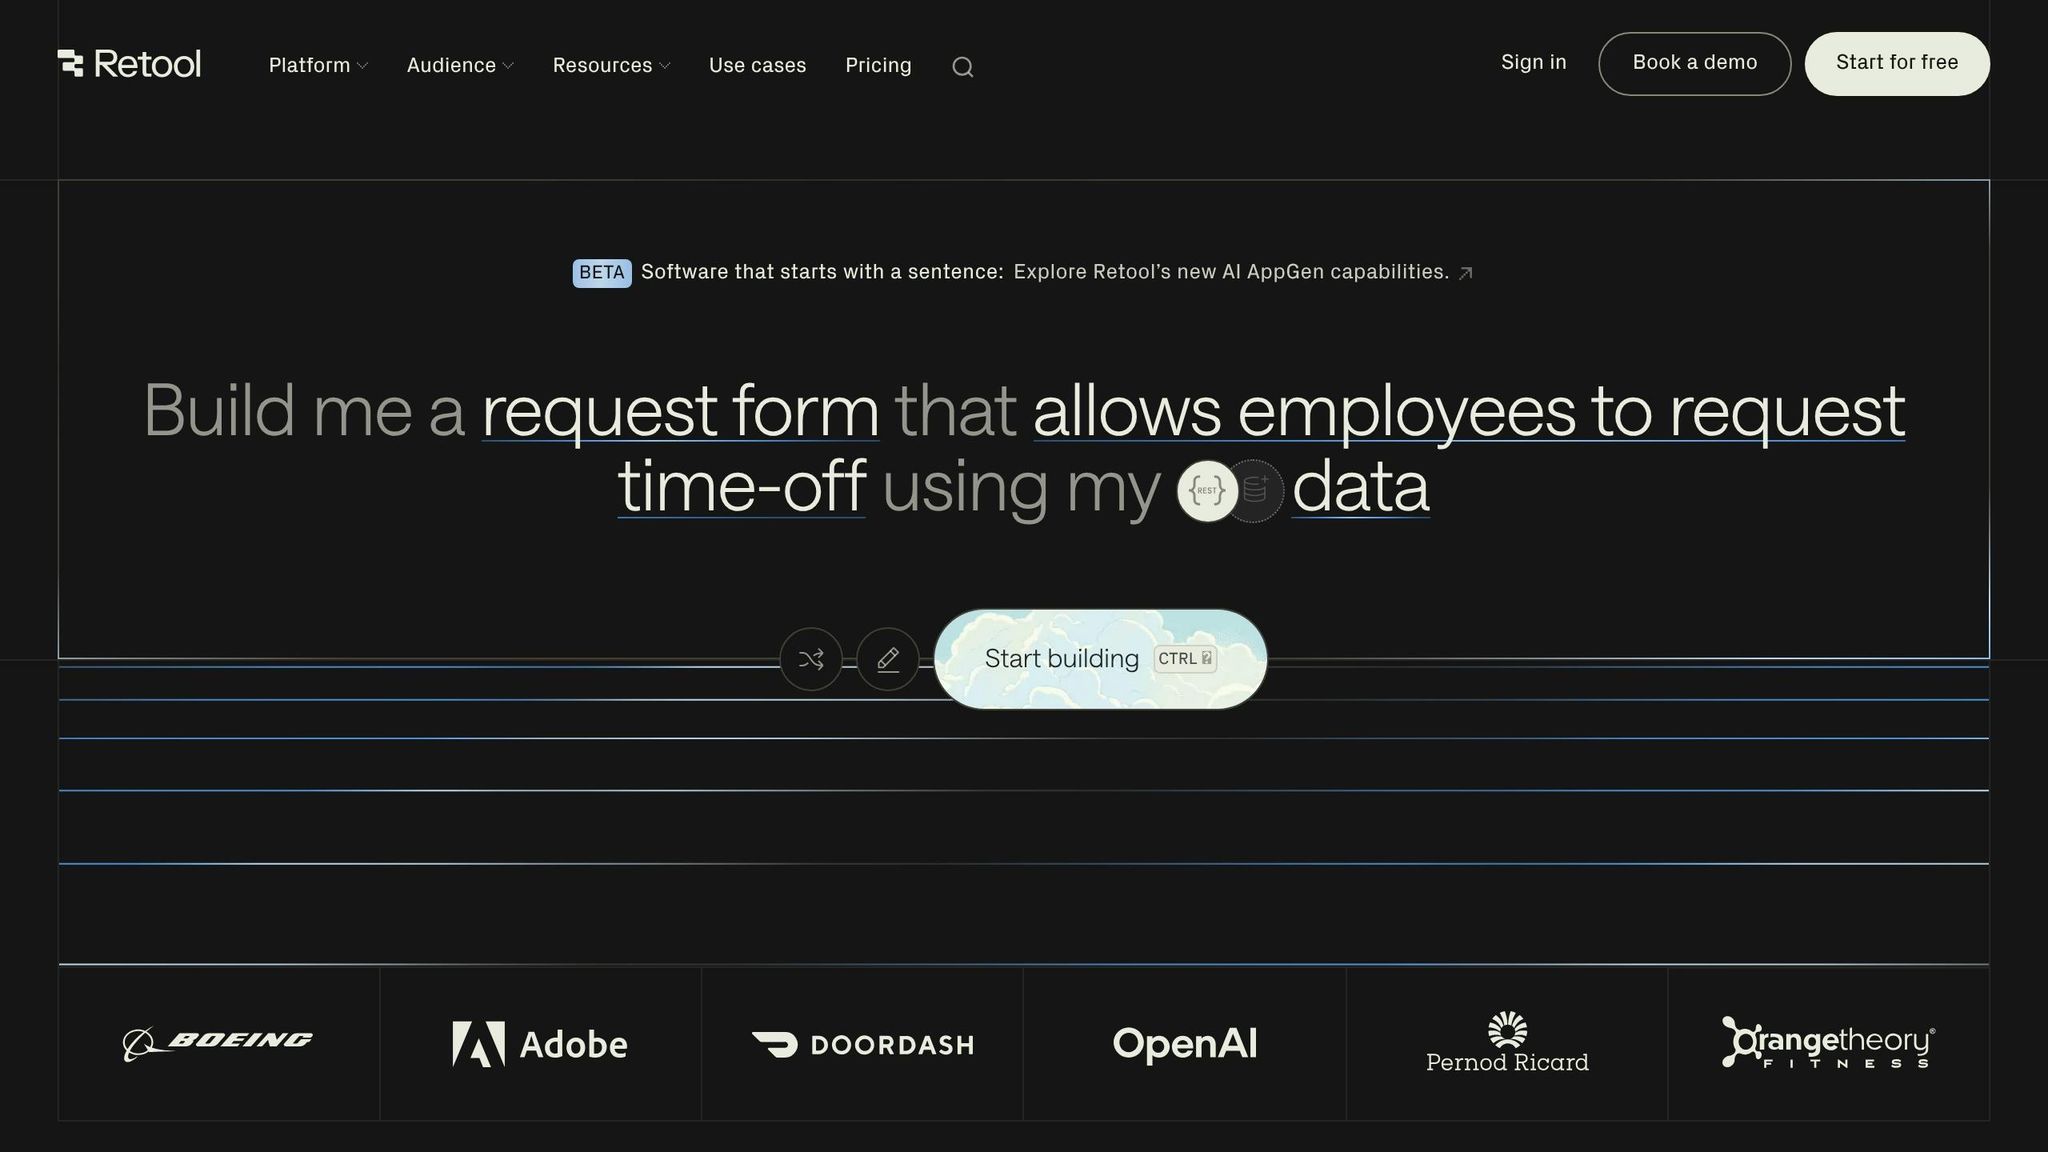
Retool showcases how AI can elevate low-code platforms, making debugging a more seamless and integrated experience. With Retool, AI debugging is built directly into the query editor, allowing you to fix broken code effortlessly. When a query fails, you'll see a "Run error detected. Debug?" prompt. This feature analyzes your SQL, JavaScript, or GraphQL code, along with your data schema and error message, to figure out what went wrong. The AI provides an explanation of the issue and suggests a fix, which you can review and apply manually if it looks good. Nothing happens automatically, so you're always in control, and every AI-generated adjustment is logged in the app's version history for transparency.
AI Error Detection
Retool uses gpt-4o-mini for its "Ask AI" feature, which can be activated with Ctrl+Alt+. (Windows) or Option+Command+. (Mac). This AI tool has a strong grasp of ToolScript, a JSX-style language that defines app structures and nested components, enabling it to offer highly accurate suggestions. Additionally, Retool includes an automated Linting tab to catch JavaScript issues like undefined variables or invalid syntax before they lead to runtime errors.
"Ask AI uses context about the query, schema, and the error message. It can then explain the problem and provide a possible fix." - Retool Documentation
These features go beyond just error detection, expanding into detailed code analysis.
Code Analysis Accuracy
Retool’s debugging tools provide detailed insights by logging all errors with full stack traces, ensuring no silent failures go unnoticed. The Timeline tab offers a visual representation of how parallel queries run, helping you pinpoint performance issues, while the State tab maps out dependencies between components, making it easier to trace what triggers specific actions. In contrast, some no-code tools fall short in this area, often delivering vague "Error" messages that require browser-level inspection.
Retool integrates these capabilities throughout its development environment, making AI-driven debugging a core part of its workflow.
Integration with Workflows
AI debugging is available across Retool’s ecosystem, from the App IDE to the Query Library, where you can test queries in a staging environment before pushing them live. Retool Workflows supports multi-step AI actions, complete with built-in monitoring and audit trails. You can even @mention specific queries or resources to give the AI more context, enhancing the accuracy of its suggestions. These AI tools are currently in public beta and accessible on all Retool plans, including self-hosted setups.
Infrastructure Scalability
Retool’s AI is designed to handle large-scale environments, efficiently managing workspaces with hundreds or even thousands of schemas by fetching only the necessary context when needed. Importantly, it processes only schema details, column names, and data types - never sensitive records. Retool also boasts a 99.88% uptime over 90-day periods and serves over 10,000 companies, ranging from startups to Fortune 500 giants.
sbb-itb-3a330bb
2. Mendix
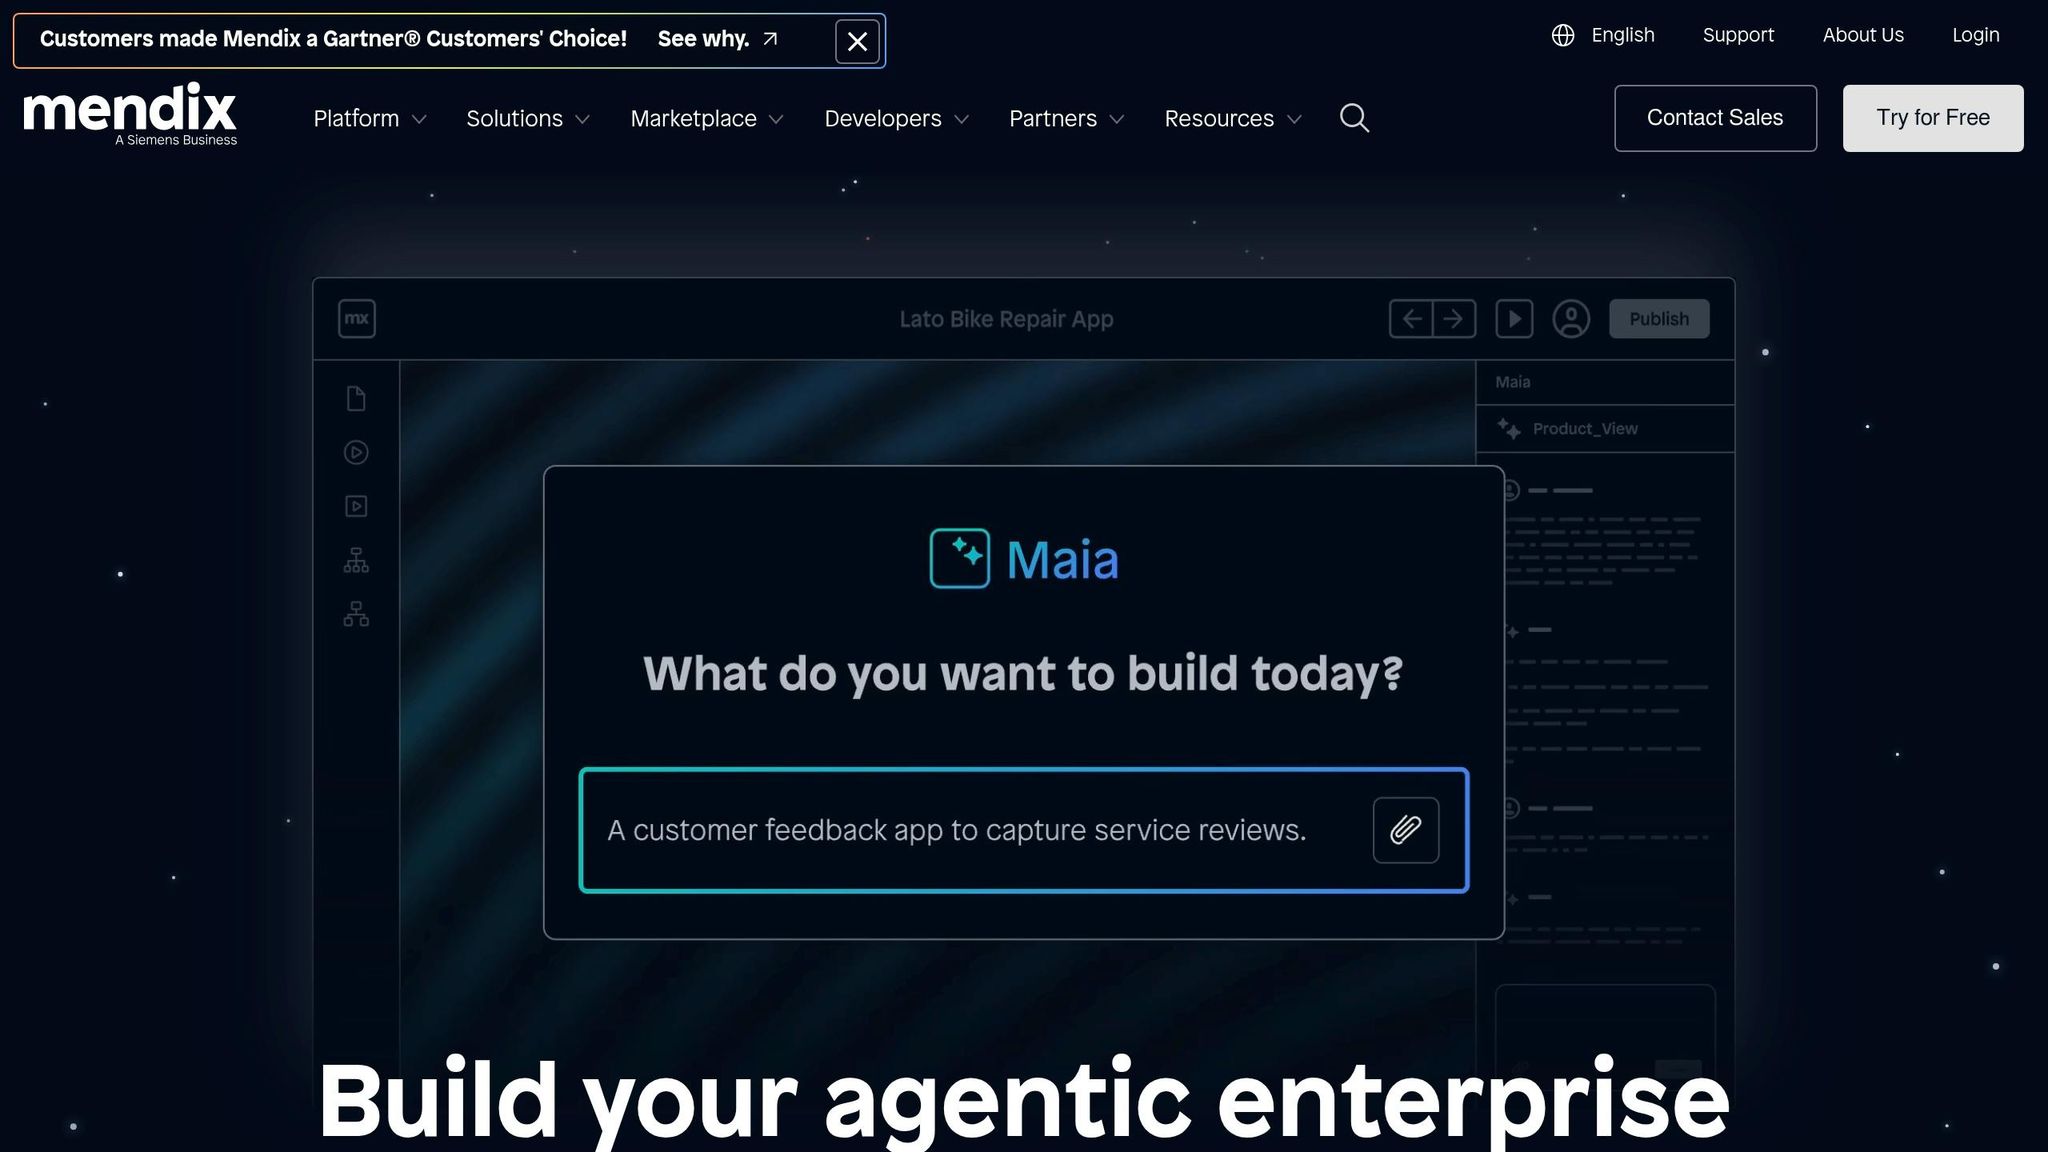
When building low code applications with Mendix, the platform incorporates AI Assistance (Maia) to handle everything from basic technical checks to advanced performance and design evaluations. This approach separates routine validation tasks, managed by the Consistency Checker, from more advanced AI-driven analysis that identifies functional anti-patterns and performance issues. In essence, Mendix doesn't just find syntax errors - it digs deeper to uncover design flaws that could impact performance, offering a layered error detection system.
AI Error Detection
The Best Practice Recommender (formerly known as MxAssist Performance Bot) evaluates your app model against Mendix's development standards. It scans components like microflows, domain models, pages, and security settings to identify anti-patterns. The process is structured into three steps:
- Detection: It identifies the issue and pinpoints the exact element causing it.
- Explanation: It outlines the impact and provides clear guidelines for fixing the problem.
- Resolution: With one click, it can automatically apply the best practice to resolve the issue.
The Logic Recommender, trained on 12 million anonymized application logics, offers suggestions for the next best microflow actions. This helps developers avoid logic errors before implementation.
"The bot can automatically implement the best practice and fix the issue in just one click." - Mendix
For legacy code, Maia Explain uses Llama 3.1 8B to summarize microflow or nanoflow logic, saving developers time when analyzing older projects.
Code Analysis Accuracy
Mendix enhances clarity in debugging by combining statistical insights with expert best practices. Its AI models are built on the analysis of thousands of anonymized applications rather than relying solely on generic language models. Mendix also claims to be the first Low-Code Application Platform to embed machine learning models directly, avoiding exclusive dependence on API-based integrations. For debugging production apps, developers can set breakpoint conditions like $currentUser/name = 'YourUserName', ensuring the application halts only for specific users and not others.
Integration with Workflows
With Studio Pro 11.8, Maia Make consolidates AI-assisted development into a single conversational IDE interface. The platform supports external tool integration through its Model Context Protocol (MCP) client, enabling workflows like:
- Figma for seamless design-to-app processes.
- Playwright for automated testing.
- Eclipse for custom Java code debugging, with the Mendix Runtime embedded for local or remote debugging.
The Workflow Recommender offers tailored suggestions for modeling business processes, while the Performance Bot can be run via the mx Command-Line Tool, streamlining error detection within CI/CD pipelines.
Infrastructure Scalability
Mendix applications are inherently cloud-native and containerized, offering features like auto-provisioning and auto-healing across public, private, and hybrid cloud environments. The platform supports third-party integrations, such as Amazon Bedrock and OpenAI on Azure, through its "Bring Your Own LLM" option, enabling custom AI functionalities. Importantly, Maia ensures data privacy by not using project, customer, or company data for model training. Developers can also disable "Usage Data" in Studio Pro preferences to prevent storage of prompt analytics. This cloud-native approach ensures Mendix's AI-driven debugging and development capabilities can scale effortlessly to meet enterprise demands.
3. OutSystems
OutSystems stands out with its AI Mentor System, a feature that deploys multiple specialized "mentors" to tackle different aspects of development. Each mentor has a specific focus: the Security Mentor pinpoints vulnerabilities, the Performance Mentor identifies bottlenecks, the Architecture Mentor enforces best practices, and the Maintainability Mentor detects duplicated code across applications. These mentors conduct reviews every 12 hours, helping to catch potential issues long before they reach production. This setup provides a strong foundation for error detection, code analysis, workflow integration, and scalability.
AI Error Detection
OutSystems uses advanced AI techniques to deliver precise error detection. Its proprietary Regular Graph Pattern (ReGaP) technology identifies complex issues like inefficient nested database queries. Additionally, the platform incorporates BugOut, which auto-generates tests to cover all edge cases. Impressively, BugOut achieves 100% edge coverage, far surpassing GPT-3.5's 74.7%, while also reducing test errors to zero compared to GPT-3.5's average error rate of 5.4%.
"AI Mentor System is like having a team of experts enhancing and extending the collective expertise of your team. OutSystems is catching potential issues and serving up solutions for the dev team, so they can focus on creating awesome solutions." - Gonçalo Gaiolas, Chief Product Officer, OutSystems
Code Analysis Accuracy
OutSystems is the only major low-code platform to support Static Application Security Testing (SAST), enabling seamless integration with third-party enterprise tools for automated security validation. Its AI-powered tools analyze application dependencies in real-time, flagging misconfigurations or architectural violations. Companies using OutSystems report 56% fewer bugs and better overall performance, with 75% of software executives noting up to a 50% reduction in development time.
Integration with Workflows
Organizations like McConkey Auction Group rely on the AI Mentor System with weekly dashboard reviews to proactively resolve code issues. OutSystems integrates with external tools through its SAST API for security testing (e.g., SonarQube, Veracode) and its OpenTelemetry API for exporting logs to platforms like Datadog or New Relic. Its built-in DevSecOps capabilities automate quality assurance and provide AI-driven dependency analysis with custom alerts.
Infrastructure Scalability
OutSystems offers built-in infrastructure with features like auto-scaling and load balancing, ensuring applications can handle growing demand seamlessly. Its cloud-native architecture supports enterprise-level deployments while maintaining AI-enhanced debugging across distributed systems. The platform’s Integration Builder simplifies connectivity with 13 commonly used data sources, including SAP, Salesforce, and MongoDB, through wizard-style configurations that eliminate the need for manual coding.
Pros and Cons
When it comes to AI-powered debugging in low-code environments, each platform has its own strengths. These differences become evident when looking at how they manage error detection, code analysis, workflow integration, and scalability. Here's a quick breakdown of their key features:
| Platform | AI Error Detection | Code Analysis Accuracy | Workflow Integration | Scalability |
|---|---|---|---|---|
| Retool | Debug tools include Console, Timeline, State, and Linting tabs for JavaScript debugging | Chrome DevTools-style interface familiar to developers | - | Optimized for JavaScript-heavy applications |
| Mendix | Maia AI offers proactive error detection and automatic logic recommendations | Best Practice Recommender can auto-fix issues | Automated issue fixing minimizes manual work | - |
| OutSystems | AI Mentor System with specialized mentors | SAST and real-time dependency analysis | Integrated DevSecOps with external API support | Cloud-native auto-scaling and load balancing |
Retool excels with its JavaScript-focused debugging tools, making it a strong choice for developers who rely heavily on JavaScript. Mendix, on the other hand, shines with Maia AI, which not only detects errors but also suggests and implements fixes automatically. Meanwhile, OutSystems offers a comprehensive approach with its AI Mentor System, real-time code analysis, and seamless scalability through cloud-native features.
This comparison highlights how each platform adapts its AI debugging tools to meet specific needs in low-code development, ensuring faster and more efficient workflows tailored to different challenges.
Conclusion
Choosing the right AI debugging tool depends on what matters most to your organization, as highlighted in this overview of low-code development platforms. Retool is a solid pick for teams comfortable with JavaScript, thanks to its user-friendly interface for building internal tools. Pricing starts at $10 per user/month. Mendix, backed by Siemens, takes a model-driven, cloud-native approach, encouraging collaboration between business and IT teams. With tight integration into Siemens and SAP systems, it starts at $998/month, making it a great fit for businesses needing seamless IT and business alignment. For enterprise-level performance, OutSystems shines. It leverages Kubernetes for scalability, supports millions of users, and generates optimized C# and JavaScript code for developer control. Pricing begins at $36,300/year for 100 users.
FAQs
How do AI debugging tools work in low-code apps with hidden logic?
AI debugging tools in low-code apps are like a behind-the-scenes tour, making hidden processes easier to understand. Many of these tools use visual tracing to map out how data moves and decisions are made, making it simpler to pinpoint issues. Some even go a step further, offering AI-driven suggestions to fix errors as they happen or linking outputs to specific data points for a deeper dive into the root cause. These features streamline the debugging process, cutting down on time and effort for both developers and non-technical users alike.
Which platform is best for JavaScript-heavy debugging needs?
For debugging JavaScript-heavy applications, the FREE AI JavaScript Code Debugger by Workik stands out. It supports popular frameworks like React.js, Vue.js, Angular, and Node.js. This tool provides AI-powered debugging, identifies errors, suggests performance improvements, and even includes features for team collaboration.
Another strong contender is AI Debugger MCP, which works seamlessly with Microsoft’s vscode-js-debug adapter. It offers comprehensive debugging for both JavaScript and TypeScript, including Node.js applications. While both are excellent choices, Workik focuses specifically on JavaScript environments, making it a dedicated tool for those needs.
How do these tools protect sensitive data during AI debugging?
Secure debugging tools play a critical role in protecting sensitive information. They implement strong security measures like secure data integration, access controls, and adherence to data protection standards. Additionally, they use data sensitivity tags to regulate access, ensuring only authorized individuals can handle specific information. These safeguards are designed to keep sensitive data secure throughout the debugging process.