APIs are the backbone of the internet, powering most of the web traffic we rely on daily - from online shopping to streaming services. But when APIs fail, the impact can be immediate and disruptive. Real-time API monitoring solves this by continuously tracking key performance metrics like latency, error rates, and uptime.
Here’s why it matters:
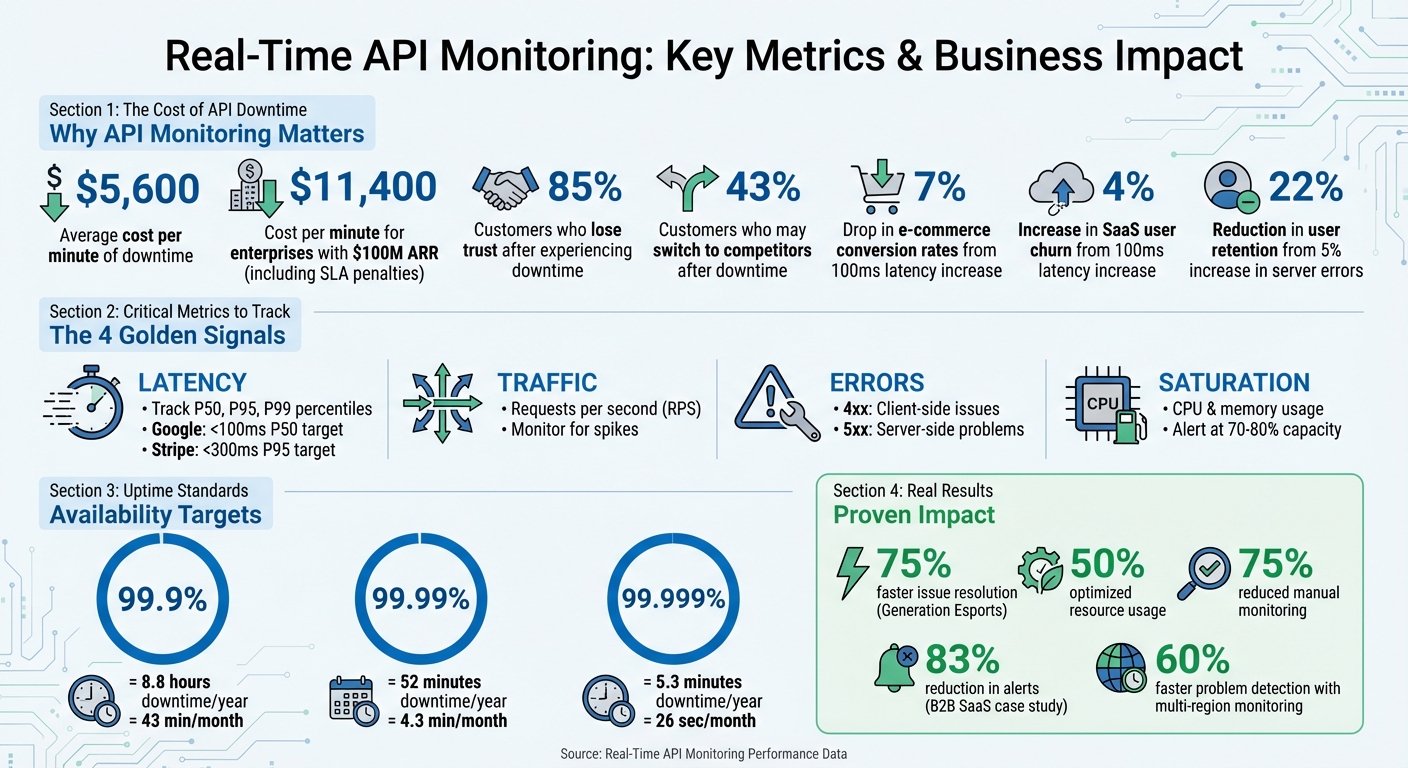
- Downtime is expensive: Businesses lose an average of $5,600 per minute during outages.
- Silent failures are common: APIs may return a "200 OK" status while delivering incomplete or incorrect data.
- User trust is fragile: 85% of customers lose trust after experiencing downtime, and 43% may switch to competitors.
By monitoring APIs in real time, you can:
- Detect issues early, reducing downtime and disruptions.
- Improve performance by identifying and fixing bottlenecks.
- Maintain reliability, ensuring smooth workflows and user satisfaction.
For platforms relying on APIs - like low-code/no-code tools - this is especially important. A single broken API integration can halt entire workflows, making monitoring a must-have.
Real-Time API Monitoring: Key Metrics and Business Impact Statistics
API Monitoring & Observability & Insights | demo with Treblle
sbb-itb-3a330bb
Key Metrics to Track in Real Time
When it comes to maintaining smooth API performance, some metrics are more critical than others. Focusing on these can help you identify and address issues before they disrupt your service.
Core Metrics to Monitor
To monitor APIs effectively, start with the essentials. Latency measures the time it takes for an API to respond, but averages can be misleading. Instead, track latency percentiles like P50, P95, and P99 to catch outliers. For example, P99 latency highlights delays that affect the most complex or critical user queries. Google advises keeping P50 latency under 100 ms for a responsive experience, while Stripe aims for P95 latency below 300 ms.
Error rates track the percentage of failed requests. Breaking errors into categories is helpful: 4xx errors often indicate client-side issues (like invalid authentication), while 5xx errors point to server-side problems. Even a small rise in server errors - say, 5% - can reduce user retention by as much as 22%. Throughput, measured in requests per second (RPS), shows the volume of traffic your API handles. Spikes in RPS can signal potential issues like DDoS attacks or misconfigured retry loops.
Availability looks beyond simple uptime. While uptime measures whether the server is online, availability checks if the service is actually working as intended. For instance, 99.9% uptime allows about 8.8 hours of downtime annually, but raising that to 99.999% limits downtime to just over five minutes. Lastly, resource utilization - such as CPU and memory usage - can offer early warnings. Spikes in resource usage often precede latency issues, giving you time to scale up before users experience slowdowns.
Using Metrics for Early Problem Detection
These metrics aren’t just for tracking - they’re also a powerful tool for spotting problems early. For example, a B2B SaaS platform serving 2,000 enterprise customers noticed its P99 latency for report generation jump from 1.2 seconds to 4.8 seconds over 45 deployments. By using version-tagged metrics and distributed tracing, they found that six deployments introduced inefficient database joins. Fixing the database indexes reduced P99 latency to 900 ms and cut alerts by 83%.
Another example comes from Generation Esports, which supports over 20,000 users and 5,000 schools. By adopting real-time API and infrastructure monitoring in 2024–2025, they resolved issues 75% faster, optimized resource usage by 50%, and reduced manual monitoring by 75%. The key here is setting alerts that focus on sustained performance drops rather than reacting to every minor fluctuation. This approach helps prioritize real threats to service level objectives, keeping operations efficient and reliable.
Benefits of Real-Time API Monitoring
Early Issue Detection and Reduced Downtime
Real-time monitoring plays a crucial role in identifying problems as they happen, helping to prevent costly downtime. To put it into perspective, downtime costs can average $5,600 per minute, and for enterprises generating $100 million in annual recurring revenue, this can climb to approximately $11,400 per minute when factoring in direct revenue loss and SLA penalties.
One standout advantage is catching "silent failures." These occur when an API returns a "200 OK" status but delivers incorrect or incomplete data in the response body. Traditional uptime checks often miss these subtle issues, but real-time monitoring goes a step further by validating the payload to ensure it matches the expected data structure. By setting performance baselines, systems can detect even minor deviations, such as a gradual increase in latency, before they become major problems. Similarly, setting alerts when resource usage hits 70–80% capacity provides teams with enough time to scale resources and avoid hitting critical thresholds. These proactive measures not only minimize disruptions but also lay the groundwork for smoother performance.
Better Performance and Faster Response Times
Beyond identifying issues, real-time monitoring helps teams fine-tune performance more quickly. By tracking the right metrics, it becomes easier to eliminate bottlenecks that can frustrate users. For instance, a mere 100ms increase in payment API latency can lead to a 7% drop in conversion rates, directly affecting revenue for e-commerce businesses. Real-time monitoring pinpoints these slowdowns by focusing on key latency percentiles, such as p95 and p99, instead of relying solely on averages.
Monitoring across multiple regions further enhances performance by spotting localized network or CDN issues that may impact specific user segments. SaaS companies, for example, have been able to detect problems 60% faster using this approach compared to single-location monitoring. This significantly reduces mean time to resolution (MTTR) and helps minimize customer complaints.
Improved Reliability and Business Insights
Reliability is about more than just keeping servers running - it’s about maintaining user trust. Real-time monitoring ensures this trust by keeping tabs on third-party services like Stripe or AWS, alerting teams to vendor outages before customers are affected.
The insights gained from monitoring are just as valuable as the reliability it provides. Data from monitoring reveals trends in API usage, unique customer behaviors, and metrics like "Time to First Call", which gauges the quality of the developer experience. These insights connect technical performance to business outcomes, showing how latency spikes can lead to cart abandonment or how error rates impact user retention. For low code and no code platforms, this data highlights which integrations deliver the most value and where development efforts should be focused. For more details on optimizing performance in these environments, check out the Best Low Code & No Code Platforms Directory.
How Real-Time Monitoring Works
Real-time monitoring uses targeted strategies to quickly identify and address problems, ensuring smoother issue resolution and improved API reliability.
Synthetic Checks and Distributed Tracing
Two key methods make real-time monitoring effective: synthetic monitoring and distributed tracing. Synthetic monitoring acts as a proactive system, running automated scripts every one to five minutes to simulate user interactions - even during off-peak times. This approach often uncovers problems before users are affected.
When synthetic checks flag an issue, distributed tracing steps in to locate the root cause. It tracks the journey of a request through microservices, databases, and external APIs, identifying whether the problem lies in a slow database query, an inefficient code loop, or a delayed response from a third-party service like Stripe's payment API. For instance, Shopify leveraged distributed tracing to cut its incident resolution time by 75%.
Modern systems often use OpenTelemetry to gather traces, metrics, and logs in a standardized way across various programming languages and platforms. By using HTTP headers (like traceparent) to pass trace IDs between services, teams can trace a single transaction across their entire infrastructure.
Setting Up Alerts
Alerts are only effective if they strike the right balance between sensitivity and practicality. Overloading your team with false alarms can be counterproductive. Start by identifying your most critical endpoints - areas like authentication, payment processing, or third-party dependencies such as Stripe or AWS should be monitored most closely. For these APIs, set checks to run every minute, while less critical endpoints can be checked every 5 to 15 minutes.
Thresholds for alerts can be based on static limits (e.g., response times exceeding 500 ms) or dynamic baselines that measure deviations from typical performance. To reduce noise, configure alerts to trigger only after two or three consecutive failures, which helps to filter out temporary network glitches. Also, deploy monitoring across at least three geographic regions to distinguish between localized issues and global outages.
Route alerts based on severity. For example, critical failures in payment APIs should trigger SMS or PagerDuty notifications for immediate action, while minor issues like latency warnings can go to Slack or email. Additionally, don't just rely on HTTP status codes - check the actual response content, as APIs could return a 200 OK status but still deliver incomplete or incorrect data.
To make monitoring more effective, consider how your tools can integrate seamlessly with your existing systems.
Integration with Monitoring Tools
Modern monitoring tools often provide easy integration through auto-instrumentation and standardized protocols. SDKs can automatically trace HTTP requests, database queries, and external API calls. Middleware, such as Express for Node.js, can also capture key data like request durations, status codes, and payload sizes without extra effort.
The real power lies in correlating data across systems. By configuring your logging library to include traceId and spanId in every log entry, you can quickly jump from an error log to a detailed trace, making it easier to troubleshoot complex issues.
For teams using CI/CD pipelines, adopting a monitoring-as-code approach can be a game-changer. By version-controlling synthetic test scripts alongside application code, you can automate tests in staging environments before deploying to production. This helps catch issues - like broken authentication flows - before they affect users. To ensure synthetic traffic doesn’t skew analytics, tag it with identifiable headers. For high-traffic APIs, sampling 10%–20% of production requests provides enough visibility while keeping costs manageable.
Best Practices for Real-Time API Monitoring
Continuous Monitoring and Multi-Location Testing
To ensure your APIs perform reliably across a global user base, it’s essential to run checks from multiple regions - such as the US, EU, and APAC. This approach helps detect region-specific issues like network disruptions, CDN misconfigurations, or latency inconsistencies that server-side metrics alone might overlook. Regional testing plays a vital role in maintaining consistent service quality worldwide.
For critical endpoints, consider running checks every minute instead of every five. This higher frequency allows you to catch issues faster. Validate response bodies, including JSON structures and key fields, to identify subtle problems - like when an API returns a 200 OK status but delivers incorrect data. Additionally, create dedicated /health or /healthz endpoints to monitor internal dependencies, such as database connections and cache availability. These endpoints provide a more comprehensive view of your system’s health.
These strategies form a strong foundation for effective alerting and quick response mechanisms.
Automated Alerts and CI/CD Integration
Continuous monitoring becomes even more powerful when paired with automated alerts integrated into your CI/CD pipeline. This setup ensures that new code deployments don’t introduce performance issues. Automate latency comparisons (p50, p95, and p99) between releases, and configure your pipeline to block deployments or trigger rollbacks if latency increases by 30%.
To avoid overwhelming teams with unnecessary notifications, use SLO-based alerting. This method tracks error budgets and only notifies teams when reliability risks breaching your monthly SLA. Implement both fast-burn alerts for immediate outages and slow-burn alerts for gradual performance declines. Urgent alerts should be routed through channels like SMS or PagerDuty for quick action. To streamline incident response, every alert should include a link to a runbook outlining the first three steps for on-call engineers.
By catching issues early, these alerts help protect system performance and ensure smooth operations.
Defining KPIs Aligned with SLAs
Effective monitoring starts with tracking the right metrics. Focus on the "four golden signals" - Latency (response time percentiles), Traffic (throughput), Errors (rate of 4xx/5xx responses), and Saturation (resource utilization). Prioritize p95 and p99 latency metrics to uncover slow-user experiences that average response times might hide. Even small delays can have a big impact: a 100 ms increase in API response time can cut e-commerce conversion rates by 7% and raise SaaS user churn by 4%.
"API performance is not an abstract engineering concern - it directly drives business outcomes."
– Total Shift Left Team
Set saturation alerts when resource usage, like CPU or memory, reaches 70%. Waiting until resources are near maximum capacity can leave little time to prevent disruptions. For a 99.9% SLA, which allows only 43 minutes of downtime per month, your monitoring system must detect and address issues within the first minute to maintain reliability.
Focusing on these KPIs ensures that your API performance aligns with business goals and user expectations.
Conclusion
Real-time API monitoring plays a crucial role in safeguarding revenue and reducing downtime. By keeping an eye on the four key metrics - latency, traffic, errors, and saturation - you can spot performance issues before they spiral into expensive outages. Considering that APIs power the majority of web traffic, and downtime can cost businesses an average of $5,600 per minute, the stakes are high.
Taking a proactive approach to monitoring offers measurable benefits. For instance, just a 100ms increase in API response time can lead to a 7% drop in conversion rates. On top of that, 85% of customers lose trust in a service after experiencing downtime. To avoid these pitfalls, implement tools like synthetic checks, validate response bodies, and use SLO-based alerts to identify and address problems in seconds. This is especially critical for systems relying on multiple API integrations.
"API monitoring isn't optional anymore. It's the heartbeat of your application." - Webalert Team
For platforms using low-code or no-code solutions that depend heavily on third-party APIs, real-time monitoring becomes even more crucial. A single broken endpoint can disrupt workflows across the entire system, causing widespread failures.
FAQs
What’s the difference between uptime and real availability?
Uptime refers to the percentage of time a service is up and running as expected. But real availability goes beyond just uptime. It considers additional factors like latency, responsiveness, and even partial failures. These elements paint a clearer picture of how ready and accessible an API or service truly is at any given moment.
How do I detect “200 OK” responses with bad data?
Getting a '200 OK' status code doesn’t always mean the response is actually useful or correct. To dig deeper, you need to validate the response beyond just the status code. Here's how:
- Look for expected keywords such as
"status":"ok"or your app's name within the response. - Flag unexpected terms like
"error"or"maintenance"that could indicate issues. - Perform assertions to confirm the structure, accuracy, and completeness of the data.
The key takeaway? A '200 OK' status code might signal that the request was successful, but it doesn’t guarantee that the response contains the right information. Always double-check!
Which latency percentile (P50, P95, P99) should I alert on?
Monitoring the P95 latency percentile is crucial because it focuses on performance issues that impact the majority of users while excluding extreme outliers. This method is commonly suggested for ensuring effective tracking and maintaining dependable application performance.