User analytics helps no-code teams follow best practices for efficient development to make better decisions by providing real-time insights into user behavior. Instead of guessing what users need, you can track actions like clicks, navigation patterns, and drop-offs to improve your app continuously during development. This approach leads to faster updates, data-driven decisions, and a better user experience.
Key Takeaways:
- Real-Time Feedback: Spot issues (e.g., form drop-offs) and fix them immediately.
- Faster Iterations: Teams can make changes quickly without relying on developers.
- Data-Driven Decisions: Use analytics to understand user behavior and prioritize improvements.
- Improved User Experience: Analytics tools like heatmaps and session replays help identify and fix usability issues.
Tools to Consider:
- Amplitude: AI-driven insights and no-code event setup.
- Hotjar: Visual tools like heatmaps and session recordings.
- Userpilot: Real-time user engagement tracking for SaaS.
- Google Analytics: General traffic analysis with free and enterprise options.
By integrating analytics into your no-code workflow, you can shorten development cycles, reduce guesswork, and ensure your app meets user needs effectively.
Benefits of Using User Analytics in No-Code Feedback Loops
Faster Iteration Cycles
User analytics dramatically speeds up iteration cycles by enabling continuous data collection and real-time decision-making. Tom Barragry, Product Marketing Manager at GetResponse, shared how his team experienced this efficiency in October 2021:
"In the span of a recent 30-minute meeting, we decided what to track, set up the tracking, and started watching the data roll in. Getting these types of insights used to take weeks and carry a high dev cost."
By removing the need for developer involvement, teams can bypass delays caused by coding bottlenecks. Instead of waiting for engineers to implement tracking, product managers and marketers can use visual tools to monitor key user actions - like button clicks or navigation flows - immediately. For example, something as simple as repositioning a form field can be adjusted as soon as feedback highlights the need. Some teams even roll out 10–15 updates daily based on real-time user data. This kind of agility not only keeps updates flowing but also ensures decisions are based on solid insights.
Data-Driven Decisions
With faster iterations comes a shift in how teams make decisions - moving from guesswork to evidence-based strategies. Gaurav Parvadiya, CEO of Twinr, captured the risks of ignoring data:
"Running an app without data is like driving at night with the headlights off. You're moving, but every turn is a gamble."
No-code platforms make it easier to track user interactions, such as taps, swipes, and navigation paths, to uncover how people actually use a product. Funnel analysis highlights where users drop off, while engagement metrics reveal which features keep them coming back. This kind of granular insight ensures that decisions are rooted in hard numbers, not assumptions or opinions.
Better User Experience
User analytics doesn’t just speed up processes or sharpen decision-making - it directly improves the user experience. Websites with optimized UX can achieve up to 200% higher visit-to-order conversion rates and over 400% higher visit-to-lead conversion rates.
For instance, in 2025, the Webflow Growth Team made small yet impactful changes to their pricing page - shortening the header and moving CTAs higher up - which resulted in a 10% increase in signups. Similarly, Walker & Dunlop, a commercial real estate firm, saw a 56% boost in form submissions after using no-code tools to track and resolve content bottlenecks. Kokko Tso, Vice President of Digital Marketing at Walker & Dunlop, highlighted the benefits:
"Combined with Webflow's visual-first platform, Optimize and Analyze empower our teams to evolve with our clients, experiment and pivot quickly, and, ultimately, create more personalized digital experiences."
Tools like clickmaps, scrollmaps, and session replays give teams a clear picture of user behavior, helping them understand not just what users do, but why they do it. These insights make it easier to design experiences that truly resonate with users.
sbb-itb-3a330bb
Tools for Implementing User Analytics in No-Code
Analytics Tools for No-Code Platforms
Choosing the right analytics tool can turn user behavior data into actionable insights. Amplitude stands out as a leader in product analytics, trusted by over 4,500 companies. It has maintained the top spot for 22 straight quarters. Eddie Lee, VP of Product at NBC, shared:
"Amplitude provides us a richer and deeper framework beyond what we could get elsewhere. We move faster, ideate quicker and understand our users more deeply".
Amplitude offers features like AI-driven insights, no-code event setup, and flexible pricing, starting with a free plan and moving to paid options from $49/month.
Userpilot, on the other hand, caters specifically to SaaS businesses, offering tools like visual feature tagging and real-time user engagement tracking. Their plans range from $249–$299/month for up to 2,000 monthly active users.
For teams prioritizing UX research, Sprig provides in-product surveys combined with AI-powered sentiment analysis. Meanwhile, Hotjar excels at visualizing user behavior through heatmaps and session recordings. Hotjar’s free plan includes unlimited heatmaps and 35 daily session recordings, making it a great choice for smaller teams. Google Analytics remains a go-to for general traffic analysis, offering a free standard version and an enterprise-level GA 360 plan for approximately $12,500/month.
With these tools in mind, the key is to choose one that aligns with your specific goals and needs.
How to Choose the Right Tool
Finding the right analytics tool for your no-code platform depends on your primary objectives. If uncovering why users behave a certain way is your focus, tools like Hotjar or FullStory, with session replays and heatmaps, are ideal. For those prioritizing predictive insights, machine learning–powered platforms like Amplitude are better suited. Emilia Korczynska, Head of Marketing at Userpilot, highlights the advantage of no-code analytics:
"No-code analytics enable product teams and business users with limited coding skills and technical know-how to collect and analyze data".
Another factor to consider is the type of tracking the tool uses. Explicit tracking requires a setup for precise data collection, while implicit tracking automatically captures all user interactions and allows retroactive analysis. Many tools, like Amplitude, Hotjar, and Google Analytics, offer free tiers or trial periods, letting you test their compatibility before committing.
Integration is also key - ensure the tool works with your existing systems, whether that’s Slack, Salesforce, or your no-code builder. Privacy is another important consideration. Tools running trackers client-side can help keep sensitive data within the user's browser, aiding in GDPR compliance.
Explore the Best Low Code & No Code Platforms Directory
To simplify your search, the Best Low Code & No Code Platforms Directory at https://lowcodenocode.org is a valuable resource. It provides a side-by-side comparison of analytics tools tailored for no-code platforms. You can explore features, find tools that integrate with your current setup, and discover both established and emerging solutions in the no-code analytics space. Plus, platform creators can submit their tools, ensuring the directory stays up-to-date with the latest options.
Top 4 free analytics tools for no code apps & websites (beyond Google Analytics)
How to Improve Feedback Loops with User Analytics
4-Step Process to Improve Feedback Loops with User Analytics in No-Code
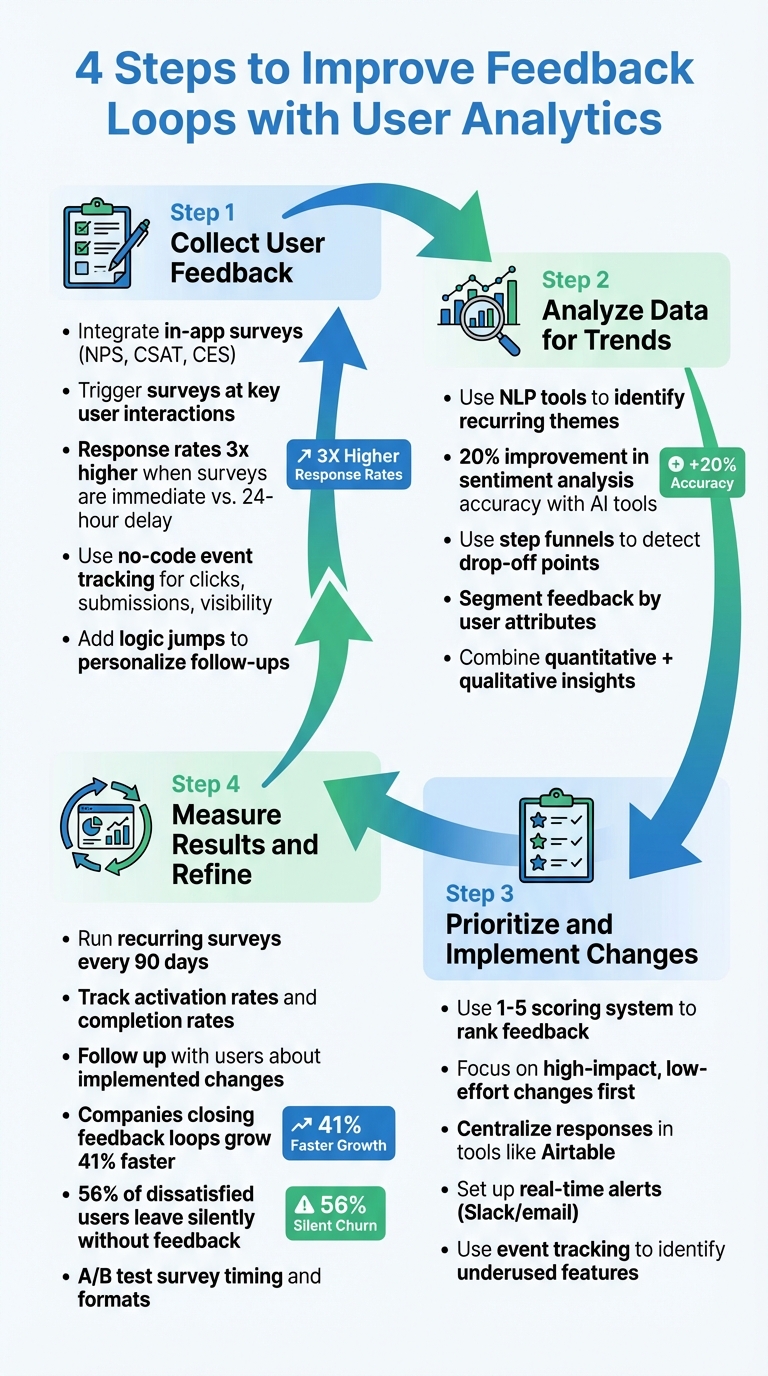
Step 1: Collect User Feedback
Integrate feedback widgets directly into your no-code app to gather user insights effortlessly. In-app surveys like NPS (Net Promoter Score), CSAT (Customer Satisfaction Score), and CES (Customer Effort Score) work best when timed to capture feedback during key user interactions . For instance, A/B testing on e-learning platforms has shown that surveys presented immediately after an action can achieve response rates three times higher than those delayed by 24 hours.
Trigger surveys strategically - after users reach milestones or try out new features. No-code event tracking tools make it easy to monitor user actions like clicks, form submissions, or element visibility without needing a developer. Add logic jumps to personalize follow-ups: if a user gives a low NPS score, ask an open-ended question about their challenges, while high scorers can be prompted for referrals .
To improve efficiency, set conditions in event trackers - like filtering by the current page URL - to reduce processing time. Link survey responses to user profiles so you can tailor future experiences or launch targeted retention campaigns based on their feedback . This data becomes the backbone of your analysis.
Step 2: Analyze Data for Trends
Once feedback is collected, dive into the data to uncover patterns in user behavior. Tools like Thematic or MonkeyLearn use natural language processing (NLP) to analyze qualitative feedback, helping you identify recurring themes in user comments . For example, Userflow improved the accuracy of its sentiment analysis by 20% with updated AI-based tools.
For quantitative insights, use step funnels to detect where users drop off during a process. A steep drop at a specific stage often signals an issue that needs attention. Segmenting feedback by user attributes - such as subscription tier, location, or usage behavior - can also reveal pain points unique to different groups . Combining numerical data with qualitative insights gives you a clearer understanding of what drives user satisfaction.
Step 3: Prioritize and Implement Changes
Turn insights into action by prioritizing feedback based on its value and feasibility. A simple 1–5 scoring system can help you rank feedback effectively. Focus on quick wins by addressing high-impact, low-effort changes first.
Centralize survey responses in a tool like Airtable using no-code automation platforms like Zapier. This streamlines the process of reviewing and prioritizing feedback. Setting up real-time alerts in Slack or email ensures your team can respond to urgent issues promptly. Additionally, event tracking can highlight underused features, guiding your team on where to focus updates without needing developer resources .
Step 4: Measure Results and Refine
Closing the loop means continually measuring outcomes and refining your approach. Use recurring surveys every 90 days to track NPS and monitor satisfaction over time . Keep an eye on metrics like activation rates (how many users interact with new features) and completion rates (the percentage of users finishing a specific flow) to evaluate success.
Following up with users to share changes made based on their feedback can significantly strengthen trust. Research shows that companies that actively close the feedback loop grow 41% faster than their competitors. Experiment with survey timing and question formats through A/B testing to improve response quality. Remember, 56% of dissatisfied users leave without saying a word, leading to "silent churn". Continuous measurement helps identify and address issues before they escalate.
Conclusion
User analytics strengthens no-code feedback loops by giving teams the ability to act on insights as they happen. By incorporating analytics into your process, you move away from late-stage User Acceptance Testing and adopt a continuous feedback model. This shift allows for real-time improvements during development, keeping your application aligned with business goals while addressing issues before they grow larger.
Using both quantitative and qualitative data offers a well-rounded view of user satisfaction. Together, these data types ensure your development stays on course and minimizes guesswork. As mentioned earlier, making decisions without data is essentially leaving outcomes to chance.
Tight feedback loops are a must. Real-time tracking enables quick responses to user issues, personalizing experiences and measuring impact immediately. With continuous feedback, your development stays agile and focused on user needs.
Check out the Best Low Code & No Code Platforms Directory to find and compare tools tailored for analytics, automation, and development. Whether you're tracking user behavior, leveraging predictive analytics, or streamlining workflows, this directory can help you find the right platform to build better applications faster.
FAQs
What should I track first in a no-code app?
To understand how users engage with your app, start by monitoring key actions that signal intent, like button clicks, page visits, or specific interactions. For example, track events such as clicking a "Create Project" button or completing significant milestones within the app.
Leverage no-code tools to set up event tracking for these important behaviors. This approach allows you to pinpoint where users drop off and create a feedback loop. With these insights, you can refine your app to better align with user needs and expectations.
How do I combine analytics data with in-app surveys?
To merge analytics with in-app surveys, consider triggering surveys based on specific user actions or attributes - like finishing a task or hitting a milestone. By analyzing feedback alongside user interaction data, you can filter by segments, behaviors, and time frames to uncover meaningful patterns. Using no-code event tracking makes it easier to monitor interactions and survey responses without needing to write code. When combined, these tools provide richer insights into user sentiment and engagement.
How can I set up analytics without a developer?
No-code tools make it possible to set up analytics without needing a developer. With platforms like Appcues and Userflow, you can track user events, monitor product adoption, and measure engagement through user-friendly interfaces. Similarly, tools such as Pimms and LogSnag simplify the process by allowing you to paste scripts or configure plugins. These options empower non-technical users to effectively monitor user behavior - all without writing a single line of code.