Low-code platforms simplify KPI tracking by enabling non-developers to create dashboards, automate workflows, and integrate multiple data sources without technical expertise. Platforms like Appian low-code provide robust frameworks for these enterprise-level automations. These tools save time, reduce manual tasks, and provide real-time insights. For example, Torigen Pharmaceuticals streamlined its processes, saving 3–4 hours daily and handling over 600 submissions monthly using a low-code solution.
Key Features to Look For:
- Real-Time Data Integration: Connect spreadsheets, CRMs, and databases with automatic updates.
- Automation and Alerts: Trigger notifications and workflows when KPIs meet certain conditions.
- Customization: Role-based access, mobile-friendly dashboards, and scalability for growing teams.
Top Platforms:
- monday.com: AI-powered insights and customizable dashboards.
- Klipfolio: Extensive integrations and dynamic visualizations.
- SimpleKPI: Quick setup for teams transitioning from spreadsheets.
- Databox: Mobile-friendly dashboards with real-time alerts.
- Zoho Analytics: Drag-and-drop dashboards with natural language querying.
Each platform offers unique features to suit different business needs, from small teams to large enterprises. Choose the one that aligns with your goals and integration requirements.
How to Build an Automated KPI Monitoring System | N8N Workflow Tutorial
sbb-itb-3a330bb
What to Look for in Low-Code KPI Automation Tools
Not all low-code platforms handle KPI tracking the same way. The right tool should connect your scattered data sources, automate responses to metric changes, and adapt as your business grows. Here are some key features to consider:
Real-Time Data Integration and Dashboards
A great KPI tool automatically pulls data from multiple sources. Platforms with a Connector Marketplace are especially useful, as they integrate directly with spreadsheets, CRMs, ad platforms, and databases. Scheduled refreshes are another must-have feature, ensuring your charts stay up-to-date without requiring manual uploads.
For users who aren't familiar with SQL, visual query builders are a game-changer. These tools let you select data sources, apply filters, and organize fields with a simple point-and-click interface - no need to rely on IT for weeks. To optimize resource use, align data refresh rates with how often your data changes. For example, financial data might only need daily updates, while logistics data could require hourly refreshes.
Workflow Automation and Alerts
Static dashboards often demand constant monitoring, but advanced platforms highlighted in industry reports eliminate this hassle with workflow automation and alerts. Threshold alerts notify stakeholders through email, Slack, or in-app messages when KPIs hit specific targets, fall short of goals, or show anomalies. Some tools even include "action tiles", allowing users to trigger workflows directly from the dashboard, bridging the gap between insights and action.
Other advanced features include anomaly detection and natural-language summaries, which explain changes in plain terms. This eliminates the need to sift through raw data, turning dashboards into proactive management tools.
Customization and Scalability
As your business grows, your KPI tool should evolve with it. Customization options like granular access controls are vital. Role-based permissions and row-level filters ensure that employees only see data relevant to them - sales reps access their territories, while executives see the bigger picture. To maintain consistency, look for platforms offering data source certification and calculation validation.
Flexibility is another critical factor. Features like embedded dashboards, branded PDF exports, and mobile responsiveness are essential for executives who need to track performance on the go. The best tools allow you to add new data sources or metrics to existing dashboards without starting from scratch. This adaptability makes a big difference for growing teams.
Next, we’ll explore specific low-code platforms that offer these capabilities.
Low-Code Platforms for KPI Tracking Automation
These platforms combine data integration with automated workflows, offering streamlined solutions for tracking KPIs without requiring extensive coding skills.
Here’s a closer look at top no-code tools that make KPI tracking more efficient through automation and user-friendly interfaces.
monday.com
monday.com transforms project data into dynamic, customizable dashboards using charts, numbers, and Gantt views. Its standout feature, monday sidekick, is an AI assistant that allows users to request data using plain language. Additionally, contextual alerts highlight critical insights and can trigger automated workflows when thresholds are exceeded. McDonald’s Australia leveraged monday.com to enhance its strategy. Business Process Lead Matt Carey noted, "To generate a game-changing strategy, we needed a game-changing technology. And that's where monday.com scored the winner". Companies using monday.com report a 25% reduction in project timelines, saving an average of 1,224 hours monthly.
Klipfolio
Klipfolio integrates data from over 100 services like SQL, Excel, Google Sheets, CRMs, and ad platforms. Its PowerMetrics feature drives dynamic dashboards, processing 6.7TB of data daily for 100,000 users. The platform supports custom visualizations using CSS and JavaScript, while App Integrations and Mashups combine data from departments like marketing, finance, and operations into unified views. This enables automated workflows across teams. Carolyn S., an Insights professional at Formstack, shared, "Klipfolio connects all of our disparate systems within our HR department. Seeing survey, HRIS, and ATS data in one dashboard is really cool". Klipfolio also offers TV dashboards for office displays, mobile apps, and automated PDF reporting, with pricing starting at $120 per month [17,18].
SimpleKPI
SimpleKPI is ideal for teams transitioning from spreadsheets. It integrates with platforms like monday.com via Zapier, instantly updating KPIs when board values change. The platform includes templates for common KPI frameworks and connects to external data sources through Zapier and APIs, automating data entry workflows. Setup is quick - most users create an automated workflow in under six minutes, allowing teams to automate KPI updates the same day.
Databox
Databox focuses on mobile-friendly KPI tracking, offering AI-driven insights that explain metric changes. The platform sends real-time alerts through email, Slack, or in-app notifications when KPIs hit predefined thresholds or exhibit anomalies, enabling immediate workflow responses. Its mobile-responsive interface is perfect for executives who need to monitor performance on the go. Automated report generation ensures stakeholders receive regular updates without manual effort, making it especially useful for distributed teams.
Zoho Analytics
Zoho Analytics simplifies reporting with drag-and-drop tools for creating dashboards - no SQL required. Its AI tool, Zia, allows users to ask natural language questions like, "What were the top-selling products last quarter?" to generate instant visualizations and trigger alerts. Supporting over 250 data sources, Zoho Analytics ensures real-time synchronization for custom tracking systems. Additional features like data source certification and calculation validation enhance data accuracy. Native integrations with Zoho’s suite of tools (CRM, Projects, Books) further streamline analytics and workflow automation.
The table below compares these platforms to help you determine which one aligns best with your business goals.
Platform Comparison Table
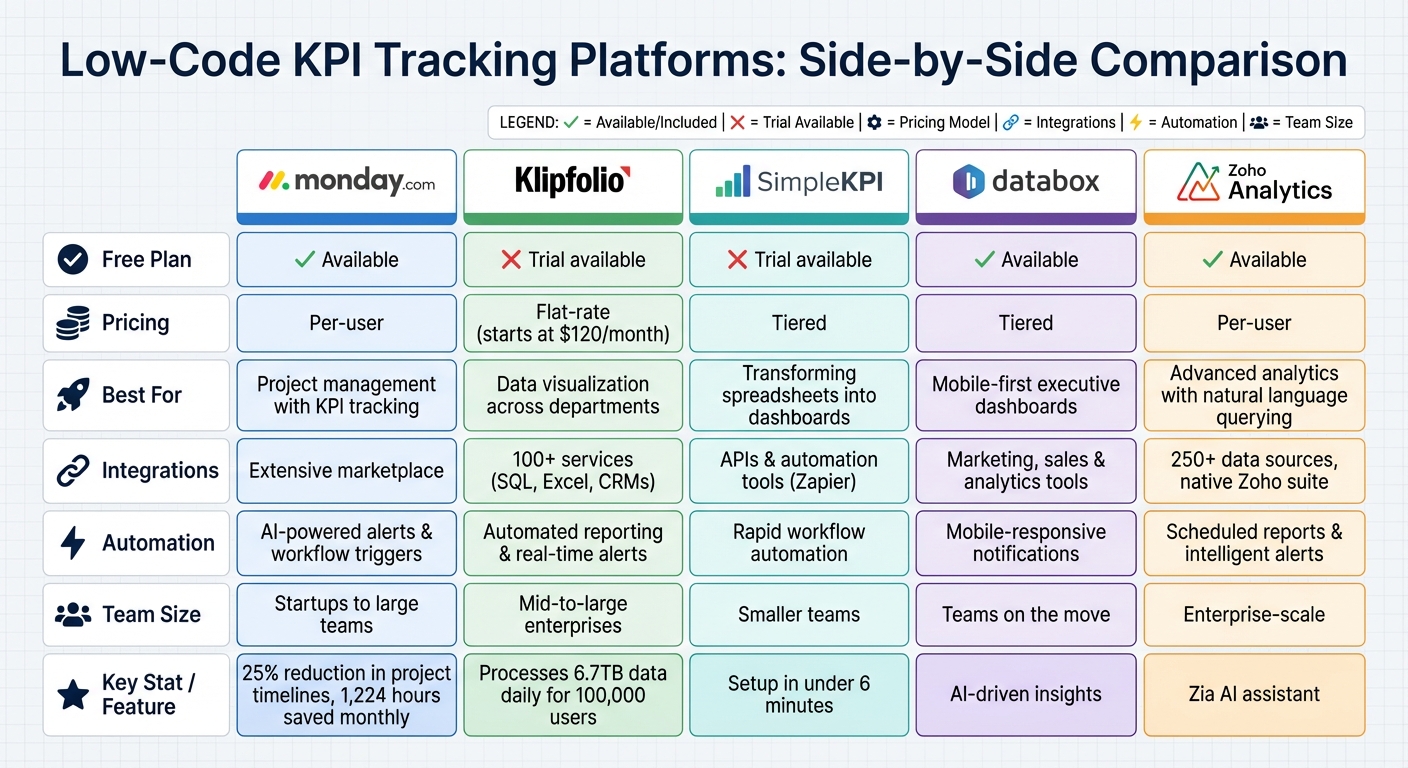
Low-Code KPI Tracking Platforms Comparison: Features, Pricing, and Best Use Cases
Comparison Criteria
Below is a table that highlights how different low-code development platforms handle KPI tracking automation. Use this as a guide to choose a platform that aligns with your team's expertise, budget, and integration needs.
| Platform | Free Plan/Trial | Pricing Model | Main Use Case | Data Integrations | Automation Options | Team Suitability |
|---|---|---|---|---|---|---|
| monday.com | Free plan available | Per-user pricing | Project management with KPI tracking | Extensive marketplace integrations | AI-powered alerts and workflow triggers | Suitable for both startups and larger teams |
| Klipfolio | Trial available | Flat-rate pricing | Data visualization across departments | Broad range of integrations | Automated reporting and real-time alerts | Fits mid-to-large enterprises |
| SimpleKPI | Trial available | Tiered pricing | Transforming spreadsheets into dashboards | Integrates via APIs and automation tools | Rapid workflow automation | Ideal for smaller teams |
| Databox | Free plan available | Tiered pricing | Mobile-first executive dashboards | Connects with marketing, sales, and analytics tools | Mobile-responsive notifications | Well-suited for teams on the move |
| Zoho Analytics | Free plan available | Per-user pricing | Advanced analytics with natural language querying | Deep integrations including native suite | Scheduled reports and intelligent alerts | Suited for enterprise-scale deployments |
Each platform brings something different to the table when it comes to KPI tracking automation. Pricing structures vary - some charge per user, while others use flat or tiered rates - making it easier to find an option that fits your budget and team size.
Integration capabilities also differ, with some platforms offering robust native integrations and others relying on third-party connectors. Automation features include AI-driven assistants, smart alerts, rapid workflows, and mobile-friendly notifications, catering to a range of team needs from small startups to enterprise-level operations.
Conclusion
Choose a low-code KPI tool that fits your team's goals and expertise, whether you're tracking straightforward operational metrics or diving into more advanced predictive analysis. Tools with drag-and-drop features work well for monitoring metrics like cycle time or backlog aging, while more traditional BI tools are better suited for complex, multi-system strategic analysis that involves predictive modeling.
To make the most of these tools, focus on your three to five most critical metrics to build the foundation of your dashboard. Set refresh intervals that match how often your data updates. Since many executives check dashboards on their mobile devices between meetings, ensure key KPI elements are easy to read on screens as small as 375px wide.
Integrate your systems deeply to avoid data gaps, which can lead to costly inefficiencies. Look for platforms with a wide range of connectors to bring fragmented data together into one cohesive view.
Set up threshold-based alerts to quickly address anomalies without needing constant monitoring. Ashley Kalinauskas, CEO of Torigen Pharmaceuticals, shared her experience with a no-code and low-code platforms that handles over 600 submissions monthly:
"We're not coders or developers, but Softr is so easy to use and learn - it lets us run with our ideas".
FAQs
How do I choose the right low-code KPI tool for my team?
When selecting a low-code KPI tool, focus on platforms offering customizable dashboards, drag-and-drop functionality, and smooth data integration. Tools that enable real-time reporting, provide interactive visualizations, and allow for flexible metrics are essential for keeping up with changing objectives. A user-friendly interface that lets you create dashboards without needing technical skills can make the tool more accessible and help your team make informed decisions with ease.
What data sources can these KPI dashboards connect to?
KPI dashboards can link up with a variety of data sources, such as workflow data, databases, enterprise systems, and tools like Google Sheets, Airtable, and Microsoft Excel. They also allow integration with REST APIs, making it possible to update and visualize data in real time.
How do I set up KPI alerts without creating too many notifications?
Low-code automation tools make it easy to build workflows that notify the right people when critical KPIs change. Tools such as PushMetrics and OttoKit allow you to define specific thresholds or conditions, ensuring that alerts are triggered only for meaningful events. These notifications can be sent through various channels like email, Slack, SMS, or WhatsApp. This way, you can cut down on unnecessary alerts and concentrate on the shifts that truly matter.