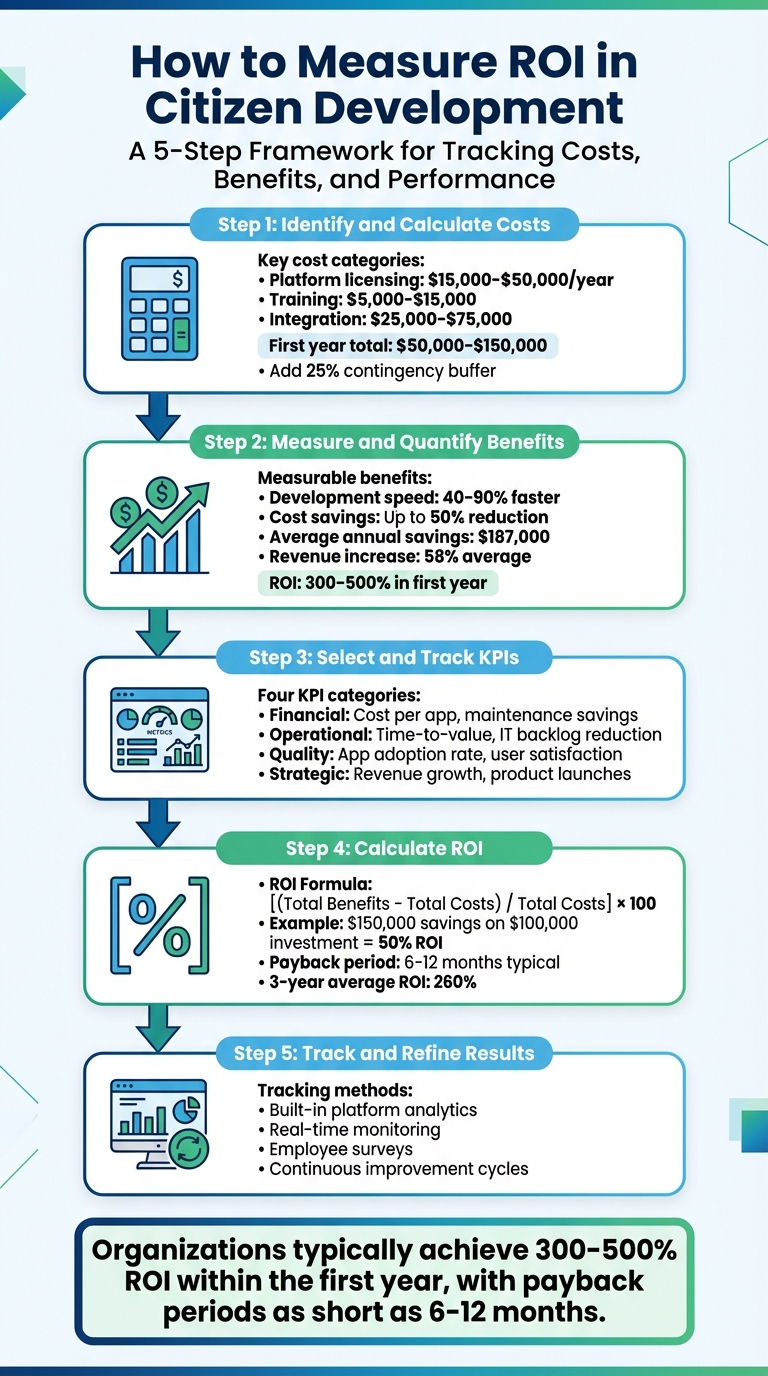
Measuring ROI in citizen development boils down to tracking costs, benefits, and key performance indicators (KPIs) to justify investments and improve outcomes. Citizen development enables faster app development at lower costs, empowering business users to create solutions without relying heavily on IT teams. This approach often delivers ROI ranging from 300% to 500% within the first year, with payback periods as short as 6-12 months.
Key Steps to Measure ROI:
- Identify Costs: Include platform licensing, training, labor, integrations, and maintenance. Example: Initial costs range from $50,000 to $150,000 for the first year.
- Quantify Benefits: Track measurable outcomes like labor cost savings (up to 50%) and faster development cycles (40%-90% reduction). Revenue growth and IT productivity improvements are common results.
- Select KPIs: Use top no-code tools and metrics like cost per app, time-to-value, and IT backlog reduction to evaluate performance.
- Calculate ROI: Apply the formula:
ROI (%) = [(Total Benefits - Total Costs) / Total Costs] × 100
Example: $150,000 in savings on a $100,000 investment delivers 50% ROI. - Track Results: Use built-in analytics, surveys, and real-time monitoring to refine and validate ROI continuously.
Low-code platforms reduce development and maintenance costs while improving efficiency and employee satisfaction. Organizations often see financial returns alongside qualitative gains, such as reduced IT strain and faster market responsiveness. By following these steps, you can confidently measure and communicate the value of citizen development initiatives.
5-Step Process to Measure ROI in Citizen Development
Step 1: Identify and Calculate Costs
Cost Categories to Include
Before you can measure ROI, it’s essential to map out all potential expenses. For low-code implementation, the initial investment typically ranges from $50,000 to $150,000 in the first year, with annual costs dropping to $20,000–$60,000 thereafter. These costs break down into several key categories.
Platform licensing is the cornerstone expense. Enterprise-grade subscriptions generally cost between $15,000 and $50,000 per year. When selecting a provider, it helps to review market leader insights to ensure the platform meets enterprise standards. Pricing varies - some vendors charge per user, others per app, and some base it on usage volume. Another upfront cost is training and onboarding, which typically runs between $5,000 and $15,000. This includes formal training sessions and the time employees spend learning instead of performing their usual tasks.
Development labor is where Low-code and no-code platforms can significantly differ from traditional IT projects. A mid-level developer’s "fully loaded" cost - including salary, benefits, and overhead - averages around $133,000 annually. Always calculate this cost using the fully loaded rate, which accounts for payroll taxes, health benefits, retirement contributions, and corporate overhead.
Integration costs are necessary to connect the new platform with your existing systems and third-party APIs. Depending on the complexity of your setup, this can cost between $25,000 and $75,000. For maintenance and support, traditional applications usually require 15–20% of the initial development cost annually, but low-code platforms can reduce this by 30–40%.
Also, consider opportunity costs - the value of IT resources either tied up in the project or freed for other strategic priorities. Don’t forget turnover costs, as replacing a developer can cost upwards of $30,000 when factoring in recruiting, onboarding, and lost productivity. Finally, include a 25% contingency buffer to account for scope changes or unexpected technical challenges.
Once these categories are outlined, the next step is to assign specific dollar amounts to each.
Converting Costs to Dollar Amounts
Turning these costs into exact figures helps you get a clearer picture. Start by calculating the "fully loaded" hourly rate for staff. For example, if a business analyst earns $70,000 annually, adding benefits (typically 30–40% of salary), payroll taxes, and overhead could bring the total cost to $100,000 per year. That works out to about $48 per hour, based on 2,080 working hours annually.
For platform costs, divide the annual licensing fee across all projects built on that platform. If the annual fee is $30,000 and you build six applications, each app would carry a $5,000 platform cost allocation. Maintenance costs should be modeled over a 3–5 year lifecycle, as costs typically drop after the initial year, once training and integrations are complete.
You’ll also need to assign a dollar value to the "cost of doing nothing." For instance, if three employees each spend five hours weekly on manual data entry at $40 per hour, that’s $31,200 annually ($40 × 5 hours × 3 people × 52 weeks). Add the cost of correcting errors - if manual mistakes require two hours of correction weekly at $60 per hour, that’s an additional $6,240 per year.
| Investment Phase | Estimated Cost Range | Description |
|---|---|---|
| Platform Licensing | $15,000 - $50,000 | Annual enterprise subscription |
| Training | $5,000 - $15,000 | Initial team enablement |
| Integration | $25,000 - $75,000 | Connecting to existing systems |
| Contingency | 25% of project budget | Buffer for scope or logic changes |
| Maintenance (Year 2+) | $10,000 - $25,000 | Ongoing updates |
For less tangible costs, such as employee burnout or morale issues, employee surveys can help estimate productivity losses or turnover risks. For example, if burnout causes a 10% productivity drop in a team of five employees earning $50,000 each, that’s $25,000 in lost output annually. These hidden costs often highlight the need for investment in low-code solutions.
sbb-itb-3a330bb
Measuring RoI and tracking KPIs for Citizen Development Projects
Step 2: Measure and Quantify Benefits
Once you've outlined the costs, it's time to focus on the benefits of citizen development. These can be split into two categories: those that can be directly measured in dollars and those that, while harder to quantify, still add substantial value to your organization.
Measurable Benefits
Citizen development can dramatically speed up development timelines. Compared to traditional IT approaches, development cycles are often reduced by 40% to 90%. This means projects that used to take months can now be completed in weeks - or even days. In fact, 71% of organizations report that low-code platforms have accelerated their development processes by at least 50%.
Cost savings are another major upside. Organizations typically see development costs drop by as much as 50%, with average annual savings reaching approximately $187,000. For example, a project costing $200,000 with traditional methods might cost only $100,000 using no-code and low-code tools. This is largely due to the lower hourly rates for citizen developers ($40–$60 per hour) compared to traditional developers ($100–$150 per hour). Maintenance costs often drop too, with reductions of 30% to 60%, thanks to low-code platforms automating infrastructure and security updates.
Revenue growth is also a measurable benefit. Customer-facing apps built with low-code tools can lead to an average revenue increase of 58%. Some organizations have even reported a 300% increase in new product launches after adopting these platforms. Faster development cycles also mean faster time-to-market, which can directly boost cash flow.
IT productivity sees noticeable gains as well. Take McDermott, an oil and gas infrastructure company, as an example. In 2015, they implemented a no-code platform that allowed 130 business users across 15 departments to develop their own applications. Within the first year, these apps processed 23,000 items and reduced IT support tickets to just 30.
Operational efficiency is another area where citizen development shines. For instance, automating a manual approval process that takes three days down to just three hours can result in significant labor cost savings when applied across multiple cycles.
The financial return on investment (ROI) is often swift. Most organizations break even within 6 to 12 months of implementing citizen development. Many report a 300–500% ROI in the first year, with an average ROI of 260% over three years. Beyond these tangible results, there are also qualitative benefits that add to the overall value.
Non-Measurable Benefits
Some benefits of citizen development don't lend themselves to easy quantification but still create meaningful improvements. For instance, 83% of users report that low-code/no-code platforms positively impact their job satisfaction. Additionally, business units are 21% more satisfied with IT lead times when using these solutions. Tools like surveys, Net Promoter Scores (NPS), and qualitative feedback can help capture these insights.
Citizen development also enhances innovation. Tracking metrics like the innovation pipeline conversion ratio - the percentage of proposed ideas that are successfully built and deployed - provides a window into how these platforms fuel creativity and execution.
"Once you take steps towards digitisation, change management across the organisation becomes much easier. People feel part of the transformation. They see the benefits of the initiatives you are running and are much keener to get involved."
- Akash Khurana, CIO, McDermott
Collaboration between business and IT improves as well. This reduces shadow IT costs and enhances data visibility. Moreover, organizational agility gets a boost, enabling companies to respond to market changes more quickly. For example, launching a new customer portal or feature in weeks instead of months can be a game-changer.
Here’s a closer look at some qualitative benefits:
| Non-Measurable Benefit | How to Assess | ROI Proxy |
|---|---|---|
| Employee Satisfaction | Surveys, NPS, Interviews | Lower turnover costs, reduced recruitment expenses |
| Innovation | Idea-to-launch ratio, product launch frequency | Gains in market share, revenue from first-mover advantage |
| Collaboration | Feedback, cross-departmental app usage | Reduced shadow IT costs, better data visibility |
| Agility | Time-to-market for new features | Savings from faster responses to competitors |
Real-time feedback tools and in-app surveys can immediately capture these qualitative benefits. Tracking how often business users independently modify applications is another way to measure empowerment.
While these non-measurable benefits may not have dollar amounts attached, they often become the most compelling reasons to continue investing in citizen development. Together with the financial ROI, they paint a complete picture of the value these tools bring to an organization.
Step 3: Select and Track Key Performance Indicators (KPIs)
Once you’ve identified your costs and benefits, it’s time to measure your citizen development initiative using KPIs. These indicators provide measurable data that highlight progress and pinpoint areas needing improvement. To get a full picture of your ROI, focus on KPIs across financial, operational, quality, and strategic dimensions.
Core KPIs for ROI Measurement
The KPIs you choose should align with your specific goals. For example:
- If your priority is to reduce IT workload, track metrics like IT backlog reduction and the frequency of support tickets.
- For operational efficiency, monitor development speed and process cycle times.
- If your focus is on digital transformation, measure how often new products launch and the resulting revenue growth.
KPIs can be divided into two types: leading indicators (such as training completion rates or prototype feedback) and lagging indicators (like cost savings or project completion time). Together, these metrics provide both early signals and final outcomes.
Here’s a breakdown of essential KPIs across four key categories:
| KPI Category | Specific Metrics | Why It Matters |
|---|---|---|
| Financial | IT expenditure, cost per app, maintenance savings, recruitment cost avoidance | Highlights the direct financial impact on your budget |
| Operational | Time-to-value, development velocity, IT backlog reduction, process cycle time | Measures faster delivery and helps resolve bottlenecks |
| Quality/Usage | App adoption rate, user satisfaction (CSAT), bug counts, iteration speed | Tracks user engagement and application effectiveness |
| Strategic | Digital transformation progress, revenue growth, new product launch frequency | Connects citizen development to broader business objectives |
For instance, 90% of developers using a low-code platform report fewer than five app requests remaining in their backlog. That’s a clear operational win. Financially, tracking metrics like cost per app offers insights into budget efficiency.
Don’t overlook qualitative data. Employee surveys and interviews can reveal improvements in satisfaction, stress levels, and collaboration.
Tracking KPIs Throughout the Project
Tracking KPIs isn’t a one-time activity - it’s an ongoing process that spans the entire project lifecycle, from brainstorming to deployment. Real-time monitoring is crucial. Instead of waiting until the project ends to evaluate results, collect live data on application usage. This allows you to address issues early and refine your approach.
Leverage data-tracking systems to simplify the process. Many low-code development platforms include built-in analytics tools that track metrics like cycle times, throughput, and bottlenecks. These features reduce the need for manual data collection and improve reporting accuracy.
Start by establishing a baseline. Use the initial figures from Steps 1 and 2 to set a reference point. For example, record how many workflow requests your IT team currently handles and how long it takes to clear the backlog without a low-code solution. This will help you compare results before and after implementation.
Take McDermott as an example: In 2015, they faced a backlog of 50 workflow requests. After adopting a no-code platform, 130 business users across 15 departments created their own applications. Within a year, they processed 23,000 items and required just 30 support tickets - a huge reduction in IT strain.
Monitor adoption rates by tracking active users and session frequency. If adoption is slow, it could signal the need for additional training or further application refinement.
"KPIs act as catalysts for continuous improvement and innovation."
- Quixy Editorial Team
Step 4: Calculate ROI Using Standard Formulas
ROI Formula and Example
The standard ROI formula is simple and effective: ROI (%) = [(Total Benefits - Total Costs) / Total Costs] × 100. This calculation helps you measure how much return you're generating for every dollar invested in your citizen development project.
Let’s break it down with an example: Suppose your organization invests invests $100,000 in a low-code platform.00,000 in one of the best no-code platforms. If traditional development would have cost $300,000, but with citizen developers, your total spending comes to $150,000, the benefit (or savings) is $150,000. Plugging these numbers into the formula gives you: ROI = ($150,000 - $100,000) / $100,000 = 50%. This means you’ve not only recovered your investment, but you’ve gained an additional 50% on top.
This formula is a great way to present value to stakeholders. However, it’s worth noting that it doesn’t factor in the time value of money, so pairing it with other financial metrics can provide a more comprehensive picture.
Alternative Financial Metrics
While ROI gives you a quick snapshot, other metrics can provide a deeper understanding of your investment’s financial performance. Here are a few worth considering:
- Payback Period: This metric tells you how quickly you’ll recover your initial investment. For low-code projects, this is often within 6 to 12 months.
- Net Present Value (NPV): NPV takes into account the time value of money, making it a useful tool for multi-year projects where benefits and costs may vary over time.
- Benefit-Cost Ratio (BCR): This ratio highlights the relationship between total benefits and total costs, making it easy for stakeholders to understand the overall value without needing to interpret percentages.
"Traditional ROI calculations often focus on upfront costs... However, with low-code, the value extends beyond these initial expenses."
- Vijay Narayanan, LinkedIn
Here’s how these metrics compare:
| Metric | Definition | Formula | Pros | Cons |
|---|---|---|---|---|
| ROI | Measures investment efficiency | [(Total Benefits - Total Costs) / Total Costs] × 100 |
Easy to understand and widely used | Doesn’t account for time value of money |
| Payback Period | Time to recover initial investment | Initial Investment / Annual Net Savings |
Highlights liquidity and risk reduction | Ignores benefits after payback point |
| Net Present Value (NPV) | Current value of future cash flows | Sum of [Cash Flow / (1 + r)^t] - Initial Investment |
Considers time value of money over several years | Requires complex calculations and a discount rate |
| Benefit-Cost Ratio (BCR) | Ratio of total benefits to total costs | Total Benefits / Total Costs |
Clearly shows cost-to-value relationship | Doesn’t reflect absolute dollar profit |
When working with these metrics, it’s smart to use conservative estimates. For example, apply higher time projections and lower benefit assumptions to build credibility with your CFO. Don’t forget to consider the "cost of doing nothing" - the hidden expenses tied to manual processes, error correction, and employee burnout in your current system.
Step 5: Tools and Strategies for Tracking ROI
Tools for ROI Tracking
Once you've nailed down your costs, benefits, and KPIs, the next step is finding the right tools to track ROI effectively. Many modern low-code and no-code platforms come with built-in analytics that can monitor key metrics like cycle times, bottlenecks, and throughput in real time. These tools not only save you from manual data entry but also provide before-and-after comparisons of process performance. This can be particularly useful for meeting compliance requirements while showing clear improvements in operational efficiency.
Online ROI calculators are another helpful resource. They allow you to compare existing manual labor costs and project timelines with the results delivered by automation platforms. For instance, Quixy’s automation has slashed direct costs by over 35%. Additionally, real-time usage monitoring helps refine ROI continuously, ensuring you're always on top of your metrics.
Don’t overlook qualitative feedback tools like surveys and interviews. These can capture the less tangible benefits - things like improved employee satisfaction, reduced stress, and enhanced collaboration. While harder to measure, these factors significantly contribute to overall value. One example is a large organization that combined hard data with user satisfaction surveys to track improvements in both operations and employee experience.
While these tools make it easier to collect and analyze data, there are still challenges when it comes to measuring ROI accurately.
Overcoming Common Challenges
Even with advanced tools, capturing every aspect of ROI can be tricky - especially when it comes to intangible benefits. Structured surveys and interviews can help convert these into measurable data. For example, the YMCA of Chicago used Kissflow to manage over 60 facility requests per month. IT Project Manager Matthew Robinson tracked not just throughput but also reductions in employee stress and operational chaos, providing a fuller picture of ROI.
To avoid data gaps, implement robust tracking systems early in your project. This ensures consistent data collection and prevents information silos. It's also crucial to align your ROI metrics with your broader business goals. For instance, if your goal is to boost efficiency, focus on metrics tied to automation and resource utilization.
Another key strategy is considering the "cost of doing nothing." Hidden costs like time wasted on duplicate data entry, error correction, and employee burnout can add up quickly. Calculating these baseline expenses can highlight the value of your initiatives. Ajit Singh, Chief Product Manager at Caratlane, emphasized this when discussing application development for warehousing and quality checks:
"Developers in an organization are scarce. It's better to manage things ourselves, especially if we have short timelines".
Starting small with non-critical pilot projects is another smart move. Use conservative estimates to show quick wins and build trust with stakeholders. These steps not only improve your ROI tracking but also set the stage for ongoing refinement and success.
Conclusion
Summary of Steps
Measuring ROI in citizen development involves a clear and structured process that turns raw data into actionable insights. Begin by identifying all the costs involved, including hidden expenses tied to manual processes. Then, evaluate the benefits - both measurable and non-measurable - such as direct savings, expanded client capacity, and better employee satisfaction, which can be gauged through surveys.
Next, choose KPIs that align with your goals by combining leading indicators (which signal early trends) with lagging indicators (which show final results). Use standard formulas and financial metrics to calculate ROI, incorporating multi-year payback models. Finally, adopt modern tracking tools for real-time insights and ensure seamless data integration to avoid silos.
This methodical approach ensures that every element of your citizen development initiative is accounted for and optimized.
Final Thoughts
Low-code platforms have shown impressive results, with organizations reporting an average 260% ROI over three years and typical payback periods ranging from 6 to 12 months. It’s important to note that ROI measurement isn’t a one-and-done task - it’s an ongoing process that fine-tunes your citizen development strategies and reinforces their value to stakeholders. Consistent tracking and refinement are essential for sustained success. As OpsTwo aptly states:
"ROI isn't a guess. It's your business case for speed, ownership, and agility."
FAQs
How do I set a baseline before launching citizen development?
To kick things off, gather at least a month’s worth of historical data on your key performance indicators (KPIs). This will help you understand your current performance levels and serve as a benchmark for tracking progress. Make sure to get buy-in from finance or other key stakeholders to confirm these metrics align with organizational priorities. Having a dependable data collection system is essential - not just for calculating ROI, but also for demonstrating the value of your citizen development efforts.
What’s the best way to quantify 'soft' benefits like satisfaction and agility?
To measure "soft" benefits like satisfaction and agility, focus on key performance indicators (KPIs) that highlight operational changes, responsiveness, and user engagement. For agility, you can track metrics such as reduced cycle times, smaller IT backlogs, and faster time-to-market. When it comes to satisfaction, consider monitoring user adoption rates, gathering feedback, and analyzing operational data like error reduction and improved process efficiency. These KPIs turn intangible benefits into measurable results, offering a clearer picture of how citizen development is making an impact.
How do I avoid double-counting savings across multiple low-code apps?
To avoid double-counting savings across different low-code apps, it's crucial to set up clear guidelines and filters within your tracking system. One way to do this is by using tools like Python scripts to spot and exclude duplicate transactions. On top of that, establish clear criteria for what qualifies as unique savings and perform regular data audits to maintain accuracy in your ROI calculations.