Monitoring data streams in real time is essential for ensuring smooth and reliable operations across data pipelines, applications, and systems. By tracking key metrics like uptime, latency, and error rates, you can spot issues early, maintain data quality, and meet performance goals. With 83% of web traffic powered by APIs and real-time data expected to make up 30% of global data by 2025, traditional batch processing is no longer enough.
Here’s a quick summary of the key practices:
- Track Metrics: Monitor uptime, latency, throughput, and error rates to identify bottlenecks or failures.
- Validate Data: Use schema and semantic validation to block bad data at ingestion and quarantine problematic records.
- Use Alerts: Set up smart notifications to address anomalies without overwhelming your team.
- Leverage Tools: Platforms like Datadog, Google Dataflow, and Grafana Cloud provide features like topology mapping, straggler detection, and unified observability.
These strategies ensure your data streams run efficiently, minimizing downtime and maintaining data integrity. The right tools and real-time monitoring can prevent disruptions and keep your systems performing at their best.
Data Streams Monitoring Demo
sbb-itb-3a330bb
Key Metrics to Monitor in Data Streams
Keeping an eye on the right metrics is what transforms a pipeline from just functional to truly reliable. The key indicators to focus on fall into three broad categories: uptime and availability, latency and data freshness, and error rates and data quality. Each of these sheds light on different aspects of a data stream’s health, helping you make better operational decisions.
Uptime and Availability
Think of uptime monitoring as your early warning system against disruptions. In production environments, the goal is typically 99.9% to 99.99% availability. Key metrics to track include job success rates and resource usage (CPU, memory, disk), which can help you catch silent failures or misconfigurations before they snowball.
Silent failures are especially tricky - they make it seem like everything’s running smoothly, but no data is actually moving through the pipeline. To counter this, set up alerts for zero throughput conditions. For example, if no data flows for 10 minutes, it’s a clear signal to investigate. When working with databases like PostgreSQL or MySQL, tracking replication slot lag or binary log position can help catch issues at the source before they disrupt downstream processes.
Correlating uptime with resource metrics can speed up troubleshooting. For instance, a sudden drop in availability paired with high CPU usage might point to resource constraints. On the other hand, if resource usage looks normal, the issue could be a configuration or network problem. These insights are critical for ensuring your data pipelines remain stable and responsive.
Latency and Data Freshness
Latency is all about how quickly data moves from its source to its destination. Breaking it down into three parts - data freshness (source to read), system latency (read to write), and total latency (end-to-end) - can help you zero in on specific bottlenecks. For example, high data freshness values might indicate that the source is overloaded, while high system latency could point to delays in internal processing.
Consumer lag is another key metric. It measures the delay between producers and consumers. For Kafka, you’d monitor consumer_lag, and for AWS Kinesis, you’d track IteratorAgeMilliseconds. If lag keeps growing, it could mean your consumers aren’t processing data fast enough or your processing logic needs optimization.
One real-world example: In 2025, LinkedIn switched from JSON to Protocol Buffers, cutting latency by up to 60% and making their systems much more responsive. Throughput - measured in events per second or megabytes per second - is another helpful indicator, as it can reveal bottlenecks in your producers or brokers. Together with uptime data, these latency metrics give you a full picture of how efficiently your system is running.
Error Rates and Data Quality
Error rates are like flashing red lights for your pipeline. They can reveal issues like failed messages, retries, or HTTP 400–500 errors, which often point to misconfigurations or unstable dependencies. High error rates can also jeopardize delivery guarantees, such as exactly-once processing, leading to duplicated or lost data.
But it’s not just about tracking errors - you also need to monitor data quality. Look out for issues like schema drift, duplicate records, or missing data. Adding validation checks at the source can stop bad data from corrupting downstream systems, like dashboards or machine learning models. Instead of discarding problematic records, consider using a "dead-letter queue" to store them for later analysis and resolution. These measures are crucial for maintaining trust in your data processing systems.
| Metric Category | Key Indicators | What High Values Signal |
|---|---|---|
| Performance | Throughput, End-to-End Latency | Bottlenecks affecting SLA compliance |
| Reliability | Uptime, Error Rates, Success Rate | System instability or configuration issues |
| Data Quality | Schema Drift, Null Rates, Duplicates | Data accuracy problems impacting analytics |
| Resource Health | CPU/Memory Usage, Consumer Lag | Need for scaling or code optimization |
For example, during a migration from Elasticsearch 6.x to 7.x, Sematext used real-time monitoring of Time To First Byte (TTFB) to confirm better performance. This kind of proactive monitoring can make all the difference in spotting and solving issues before they escalate.
Tools and Technologies for Monitoring Data Streams
Comparison of Top Data Stream Monitoring Tools and Features
Choosing the right monitoring tool is crucial for ensuring smooth data streaming operations. The options range from stream processors with built-in monitoring features to platforms designed for unified observability across diverse data sources. Each tool brings something different to the table - whether it’s topology mapping, anomaly detection powered by AI, or user-friendly no-code platforms for pipeline setups. Here’s a closer look at some tools that excel in monitoring and optimizing data streams.
In environments like Kafka and RabbitMQ, Datadog Data Streams Monitoring (DSM) provides automatic pipeline topology mapping. This feature visually connects services, queues, and consumers, making it easier to identify and resolve issues quickly.
Google Cloud Dataflow stands out with its Straggler Detection feature, which identifies slow-performing workers in large-scale jobs. Namitha Vijaya Kumar, Product Owner at ANZ Bank, noted:
"Dataflow is helping both our batch process and real-time data processing, thereby ensuring timeliness of data is maintained in the enterprise data lake".
This platform can scale to accommodate up to 4,000 workers per job and offers discounts of 20% for one-year commitments and 40% for three-year commitments.
For teams needing a unified view across multiple data sources, Grafana Cloud integrates with over 100 backends without requiring any data migration. It was recognized as a Leader in the 2025 Gartner® Magic Quadrant™ for Observability Platforms. Ron Lipke, Senior Engineering Manager at Mux, shared:
"It not only saves us hundreds of thousands of dollars a year, but it's also a forcing function for us to look closely at our metrics to find additional opportunities for time series reduction and cardinality improvements".
Grafana Cloud’s free tier is generous, offering 10,000 series Prometheus metrics along with 50GB each for logs, traces, and profiles.
Azure Stream Analytics offers serverless, no-code editing capabilities paired with machine learning for real-time anomaly detection. Microsoft supports this service with over $1 billion in annual cybersecurity R&D investments and guarantees a minimum of 99.9% API availability.
For teams focused on Change Data Capture (CDC), Google Cloud Datastream provides detailed metrics by distinguishing "Data Freshness" (time since the source write) from "System Latency" (processing time). Meanwhile, Kapacitor from InfluxData takes monitoring a step further by enabling automated actions - like scaling infrastructure or managing IoT devices - through its TICKscript language.
Comparison of Monitoring Tools
Here’s a summary of key features offered by these tools:
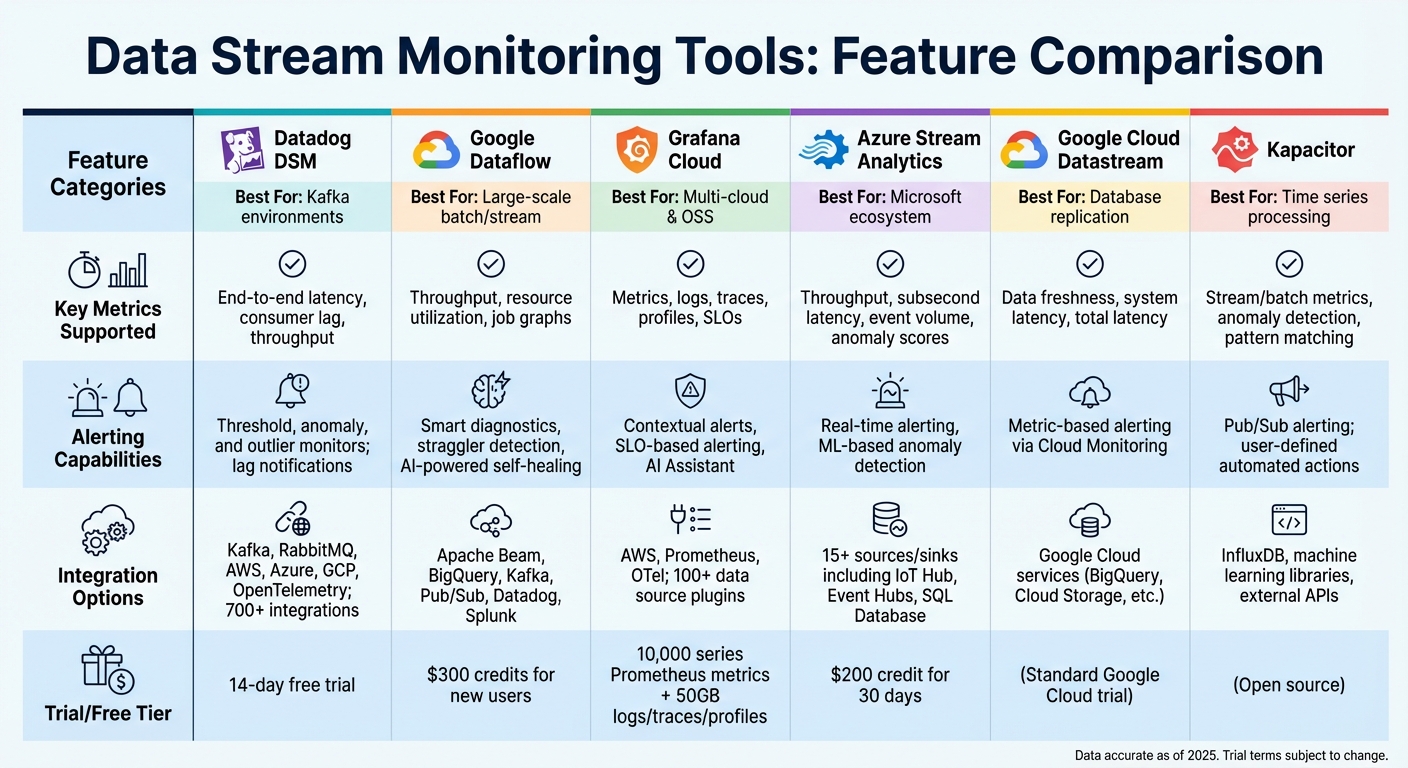
| Tool | Key Metrics Supported | Alerting Capabilities | Integration Options |
|---|---|---|---|
| Datadog DSM | End-to-end latency, consumer lag, throughput | Threshold, anomaly, and outlier monitors; lag notifications | Kafka, RabbitMQ, AWS, Azure, GCP, OpenTelemetry; 700+ integrations |
| Google Dataflow | Throughput, resource utilization, job graphs | Smart diagnostics, straggler detection, AI-powered self-healing | Apache Beam, BigQuery, Kafka, Pub/Sub, Datadog, Splunk |
| Grafana Cloud | Metrics, logs, traces, profiles, SLOs | Contextual alerts, SLO-based alerting, AI Assistant | AWS, Prometheus, OTel; 100+ data source plugins |
| Azure Stream Analytics | Throughput, subsecond latency, event volume, anomaly scores | Real-time alerting, ML-based anomaly detection | 15+ sources/sinks including IoT Hub, Event Hubs, SQL Database |
| Google Cloud Datastream | Data freshness, system latency, total latency | Metric-based alerting via Cloud Monitoring | Google Cloud services (BigQuery, Cloud Storage, etc.) |
| Kapacitor | Stream/batch metrics, anomaly detection, pattern matching | Pub/Sub alerting; user-defined automated actions | InfluxDB, machine learning libraries, external APIs |
Trial credits and free tiers vary by provider. For example, Datadog offers a 14-day free trial, Google Cloud Dataflow provides $300 in credits for new users, and Azure Stream Analytics includes a $200 credit for 30 days.
These tools empower teams to stay on top of their data streams, enabling quick detection and resolution of pipeline issues in real time.
Setting Up Real-Time Validation and Alerting
Once you've chosen your monitoring tools, it's time to set up real-time validation and alerting. This ensures that any issues in your data streams are caught and addressed immediately. By validating data as it flows in and setting up alerts, you can prevent small problems from snowballing into major ones.
Schema Validation at Ingestion
Validation should start the moment records enter your pipeline. This approach cuts detection time from hours to just seconds. Embedding validation at the source blocks bad data from moving downstream and causing further issues.
There are three main levels of validation to consider:
- Schema ID validation: This is the quickest check - it simply verifies if a known schema ID exists in the message header. However, it doesn’t confirm if the data matches the schema itself.
- Schema validation: This step ensures that records align with expected field types, offering a more thorough check.
- Semantic validation: This goes even deeper, checking field-level rules and patterns. For instance, it can confirm if email formats are correct, UUIDs are structured properly, or age values fall within a logical range (like 0–150). This level is especially important for critical applications.
When validation fails, don’t discard the faulty records. Instead, route them to a dead letter queue (DLQ) or quarantine stream for later review and reprocessing. Nawaz Dhandala from OneUptime highlights the danger of unnoticed bad data:
"Bad data is silent. It does not crash your pipeline or throw a 500 error. It slips through, pollutes reports, breaks ML models, and erodes trust."
Several tools can help streamline validation. Monte Carlo, for example, offers Validation Monitors with a library of operators to flag issues like null values or incorrect string formats, even for users with limited SQL expertise. For real-time schema validation, Validio connects directly to platforms like Kafka, Kinesis, and Pub/Sub, offering automatic schema inference for JSON. If you're using Azure, the TRY_CAST function can convert data types and flag invalid entries as NULL, allowing for triaging rather than crashing the entire job.
Once your validation system is solid, the next step is setting up alerts to act on detected anomalies.
Automated Alerts for Anomalies
Static thresholds often lead to excessive noise. Instead, adaptive thresholds powered by machine learning can help reduce false positives and focus attention on critical issues.
For instance, critical alerts - like failures involving regulated data - should trigger immediate notifications via PagerDuty, with a response time of under 15 minutes. High-severity issues might be sent to Slack with a two-hour response window, while medium-priority problems can be logged as Jira tickets for review within 24 hours. Assigning a clear incident owner can also speed up response times by about 1.5×.
Alert fatigue is a real challenge. Teams receiving over 50 alerts per week often see engagement drop by 15%, and if the volume exceeds 100, engagement can fall by another 20%. To combat this, focus on monitoring the 50–100 most crucial tables and dashboards that influence business decisions. Use smart filtering and grouping to consolidate multiple raw events into single, actionable alerts. You can also schedule "mute windows" during planned maintenance to cut down on unnecessary noise.
Tools like OpenObserve simplify alert setup with a "Quick mode" UI for building OR/AND conditions for real-time notifications. Similarly, Observe Inc provides a visual interface for setting up threshold, count, and anomaly detection monitors. Automated alerts can even trigger predefined responses - like activating circuit breakers or scaling resources - so critical issues are addressed without waiting for human intervention.
Summary of Best Practices
Effective data stream monitoring hinges on a few core principles. First, monitor key metrics like throughput, latency, error rates, and data freshness across every stage of your pipeline - from ingestion to serving. This comprehensive visibility allows you to identify and address bottlenecks before they escalate into critical issues.
Validate data at ingestion. Catching malformed data early prevents downstream problems. Invalid records should be quarantined for later analysis, ensuring uninterrupted pipeline flow while safeguarding data for recovery.
Use adaptive alerting to cut through the noise. Alerts should align with your Service Level Objectives (SLOs) and be prioritized based on their business impact. For example, data loss might trigger immediate PagerDuty notifications, while less critical issues can be logged for review.
Architect for resilience. Implement circuit breakers, retry mechanisms with exponential backoff, and distributed tracing to manage failures without disrupting the entire system.
These practices collectively support robust real-time data monitoring, ensuring reliability and efficiency. The table below summarizes these strategies for quick reference.
Summary Table of Practices
| Practice | Description | Associated Tools | Key Benefits |
|---|---|---|---|
| Core Metric Tracking | Monitor throughput, latency, error rates, and data freshness at all stages. | Prometheus, Grafana, Datadog, Kibana | Early bottleneck detection and SLA compliance. |
| Real-Time Validation | Validate data against schemas and rules at ingestion. | Great Expectations, dbt, Estuary Flow, Soda | Prevents downstream corruption and silent failures. |
| Automated Alerting | Trigger real-time alerts based on thresholds or anomalies. | PagerDuty, Opsgenie, Slack, Datadog | Faster responses and minimized downtime. |
| Distributed Tracing | Track records as they move through microservices. | OpenTelemetry, Jaeger, AWS X-Ray | Simplifies debugging in distributed pipelines. |
| Quarantine Routing | Route failed records to a separate stream for review. | Kafka (Dead-letter queues), Estuary Flow | Maintains flow while preserving data for recovery. |
| CDC Monitoring | Monitor Change Data Capture replication lag and consistency. | Google Cloud Datastream, Snowflake, Debezium | Ensures parity between source databases and warehouses. |
FAQs
Which metrics matter most for my data streams?
Key metrics to keep an eye on include throughput, latency, and error rates.
- Throughput measures how much data or how many events your system processes per second. It’s a good indicator of whether your system can handle the workload it’s designed for.
- Latency tracks how long it takes for data to be delivered, which is especially important for real-time applications where every second counts.
- Error rates give you a sense of your system’s overall health, helping you catch and address issues before they escalate.
Other useful metrics include consumer lag, which shows delays in processing; data freshness, to ensure timely updates; and system resource usage (like CPU, memory, and disk), which can help you spot and address performance bottlenecks.
How can I detect silent failures in real time?
To catch silent failures in real-time data streams, it's essential to go beyond basic threshold alerts and adopt more advanced observability techniques. Here are some key approaches:
- Anomaly detection: This method identifies unexpected patterns in data, helping you spot irregularities that might otherwise go unnoticed.
- Distributed tracing: By tracking the flow of requests through your system, distributed tracing can reveal hidden latency issues or overlooked fields in your data.
- Telemetry pipeline: Combining traces, metrics, and logs in a unified pipeline allows you to correlate data and uncover problems like incomplete datasets or schema mismatches.
These strategies are crucial for identifying issues that may seem normal at first glance but can quietly degrade your system's performance over time.
What’s the best way to reduce alert noise?
Reducing alert noise starts with clear strategies like alert suppression, threshold tuning, and crafting effective alert rules. Start by pinpointing alerts that generate excessive noise and adjust their thresholds to filter out unnecessary triggers. Focus on prioritizing critical issues over less urgent ones.
Other helpful practices include intelligent routing, which ensures alerts reach the right team, and setting severity levels to differentiate between high and low-priority notifications. Aggregating similar alerts can also cut down on false positives, making it easier to focus on what matters most. Together, these steps help combat alert fatigue and keep teams responsive to the issues that truly need attention.