Load testing low-code apps is critical for ensuring they perform well under heavy traffic. These platforms simplify app development but hide complex backend processes, making it harder to spot performance issues. Without proper testing, apps risk slow response times, crashes, and even revenue loss.
Here’s why it matters:
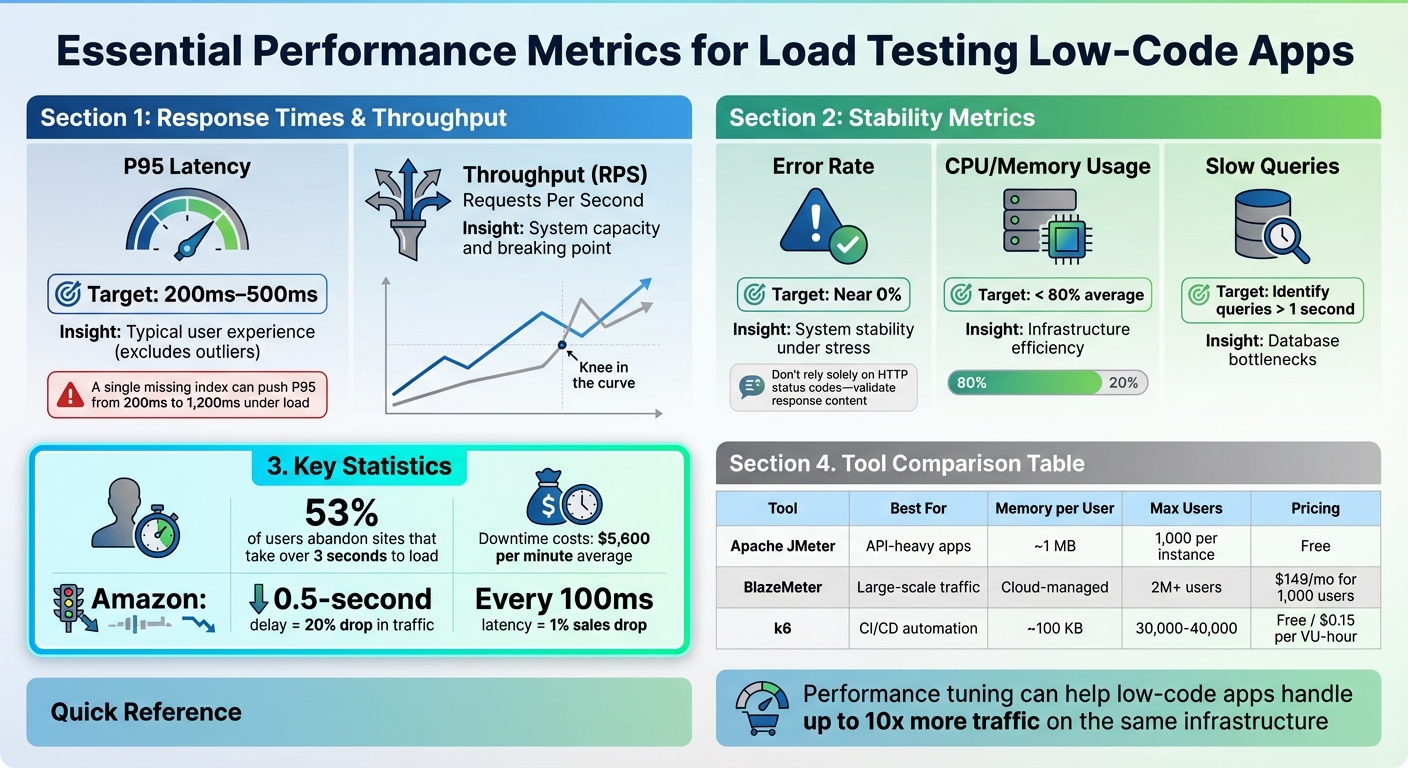
- 53% of users abandon sites that take over 3 seconds to load.
- Downtime during peak traffic costs businesses an average of $5,600 per minute.
- Even a 0.5-second delay can cause a 20% drop in traffic.
Low-code apps often rely on backend services and third-party APIs, which can create bottlenecks under load. Using top no-code tools can help streamline these integrations. Load testing helps identify these issues early, optimize performance, and ensure your app scales efficiently.
Key Takeaways:
- Track Metrics: Focus on P95 response times (200ms–500ms), throughput, error rates, and resource usage.
- Simulate Real Users: Test realistic workflows, including pauses and varied user behaviors.
- Use Tools Like JMeter, BlazeMeter, or k6: Select based on your app's needs and team expertise.
- Start Early: Integrate load testing into your CI/CD pipeline to catch issues before production.
By testing beyond expected traffic peaks and analyzing results, you can ensure your app handles user demands smoothly while minimizing infrastructure costs.
AI-Powered K6 Testing: No Code, No Hassle, Just ChatGPT! 🦾🚀
sbb-itb-3a330bb
Why Load Testing Matters for Low-Code Applications
Low-code platforms are becoming a staple in enterprises thanks to their drag-and-drop simplicity. But behind their user-friendly interfaces, these platforms can hide performance risks. Without proper load testing, you might launch an app that crumbles under real-world demand.
And the stakes? They’re huge. Downtime during peak traffic can cost enterprises $5,600 per minute on average. For e-commerce businesses, the losses can skyrocket. Google found that even a 0.5-second delay in search results caused a 20% drop in traffic. These delays don’t just hurt revenue - they erode user trust and disrupt operations.
Low-code apps face extra pressure because they often rely heavily on backend services and third-party APIs. A lagging payment gateway or a slow database query can bring the whole app to a standstill. This guide dives into these risks and explains why rigorous load testing is a game-changer.
Challenges Specific to Low-Code Apps
One major challenge with low-code platforms is their "black box" nature. Unlike traditional development, pre-built components can obscure inefficient logic, which might only become apparent under heavy traffic. For instance, workflows that seem smooth with a handful of users can fail spectacularly when user numbers surge.
Take this real-world example: In 2024, a logistics company using a Mendix-based tracking system saw its response times balloon from 2 seconds with 50 users to 12 seconds with 200 users. The culprit? Inefficient batching of database writes buried in the app's microflows. After refactoring the logic and tweaking JVM parameters, consulting firm We LowCode cut the response time to 480 milliseconds under full load and reduced cloud infrastructure costs by 30%.
"Low-code/no-code apps heavily rely on backend services... The efficiency of underlying services directly influences overall application performance."
– Abhaya, Digital Marketer and Software Testing Specialist
UI rendering is another common issue. JavaScript-heavy widgets can create bottlenecks that traditional protocol-based testing might miss. In some audits, just one or two poorly optimized workflows have been responsible for over 70% of the total slowdown. Load testing pinpoints these problem areas and turns them into opportunities for improvement.
What You Gain from Load Testing
Load testing doesn’t just highlight issues - it provides actionable insights to fine-tune performance. It helps you identify which components fail under stress, where database queries lag, and how external APIs impact your app. This is especially critical when abstraction layers hide the app’s inner workings.
With proper tuning, low-code apps can handle up to 10 times more traffic on the same infrastructure. This means fewer servers, lower cloud costs, and better resource utilization. Load testing also uncovers hidden issues like memory leaks or connection pool exhaustion that only surface under sustained load.
"Performance is not a feature you bolt on at the end. It is a fundamental quality of your software that shapes user experience, drives revenue, and determines whether your system survives its first encounter with real-world traffic."
– LoadForge
Performance Metrics to Track During Load Testing
Load Testing Performance Metrics and Thresholds for Low-Code Applications
Tracking the right metrics is essential for turning vague assumptions into actionable insights. Without proper measurement, you can’t identify where your low-code app struggles or determine how much traffic it can handle. The focus should be on metrics that highlight both user experience and system health.
Response Times and Throughput
Response time measures how long your app takes to process and fulfill a request. While averages might seem useful, they can be misleading - just one slow query can skew the results. Instead, focus on the 95th percentile (P95), which reflects the experience of 95% of users while excluding outliers.
For a smooth user experience, P95 latency should stay between 200ms and 500ms. Anything above this range risks frustrating users, potentially leading to drop-offs. A common culprit for high latency? Poor database indexing. As TheLinuxCode points out, “A single missing index can push P95 from 200ms to 1,200ms under load”.
Throughput, often measured in requests per second (RPS) or transactions per second (TPS), shows how much traffic your system can handle before it starts breaking down. When you plot latency against concurrency, look for the "knee in the curve" - a sharp increase in latency signaling the system’s limit. This might indicate bottlenecks like connection pool exhaustion or database locks.
For low-code apps, there’s another factor to consider: browser rendering time. These platforms rely heavily on client-side technologies like JavaScript, HTML, and CSS. Backend-only tests won’t capture the full picture. Use browser-driven testing tools to measure how long it takes for visual elements, such as widgets, to load and display on the screen.
Error Rates and Resource Usage
While response times and throughput measure speed, error rates and resource usage provide insight into system stability under load.
Error rates track the percentage of requests that fail, especially those returning 5XX HTTP status codes. While zero errors is the goal, some errors during events like auto-scaling are normal. However, if error rates spike uncontrollably, stop the test immediately to prevent cascading failures that can obscure the real issue. Additionally, don’t rely solely on HTTP status codes - check that response bodies contain the expected data, as even a “200 OK” can mask underlying problems.
Resource utilization, such as CPU and memory usage, helps assess whether your infrastructure is appropriately sized. During load tests, aim to keep average utilization below 80%. High usage might mean it’s time to scale horizontally (adding more servers) or vertically (increasing resources). On the other hand, low usage could indicate you’re over-provisioning and wasting resources. Pay close attention to database metrics, including slow queries, IOPS (Input/Output Operations Per Second), and active sessions, to ensure your backend can keep up with frontend demand.
| Metric | Insight | Target Threshold |
|---|---|---|
| P95 Latency | Typical user experience (excludes outliers) | 200ms–500ms |
| Throughput (RPS) | System capacity and breaking point | Varies by app; watch for the "knee" |
| Error Rate | System stability under stress | Near 0% |
| CPU/Memory | Infrastructure efficiency | < 80% average |
| Slow Queries | Database bottlenecks | Identify queries > 1 second |
Lastly, don’t overlook network traffic. Spikes in data sent or received during tests can reveal inefficiencies, such as excessive calls to third-party APIs. For low-code apps, which often depend on external services, monitoring network traffic is critical to maintaining consistent performance.
Load Testing Tools for Low-Code Apps
Choosing the right load testing tool depends on your team's skill set, the complexity of your application, and how well the tool integrates with your workflow. When you compare leading low-code platforms, performance testing becomes a critical factor in selection. Low-code applications often present unique challenges, and tools like Apache JMeter, BlazeMeter, and k6 offer tailored solutions to ensure your app performs reliably under stress. Each tool has its strengths, catering to different testing requirements - from API-heavy apps to large-scale cloud simulations.
Apache JMeter
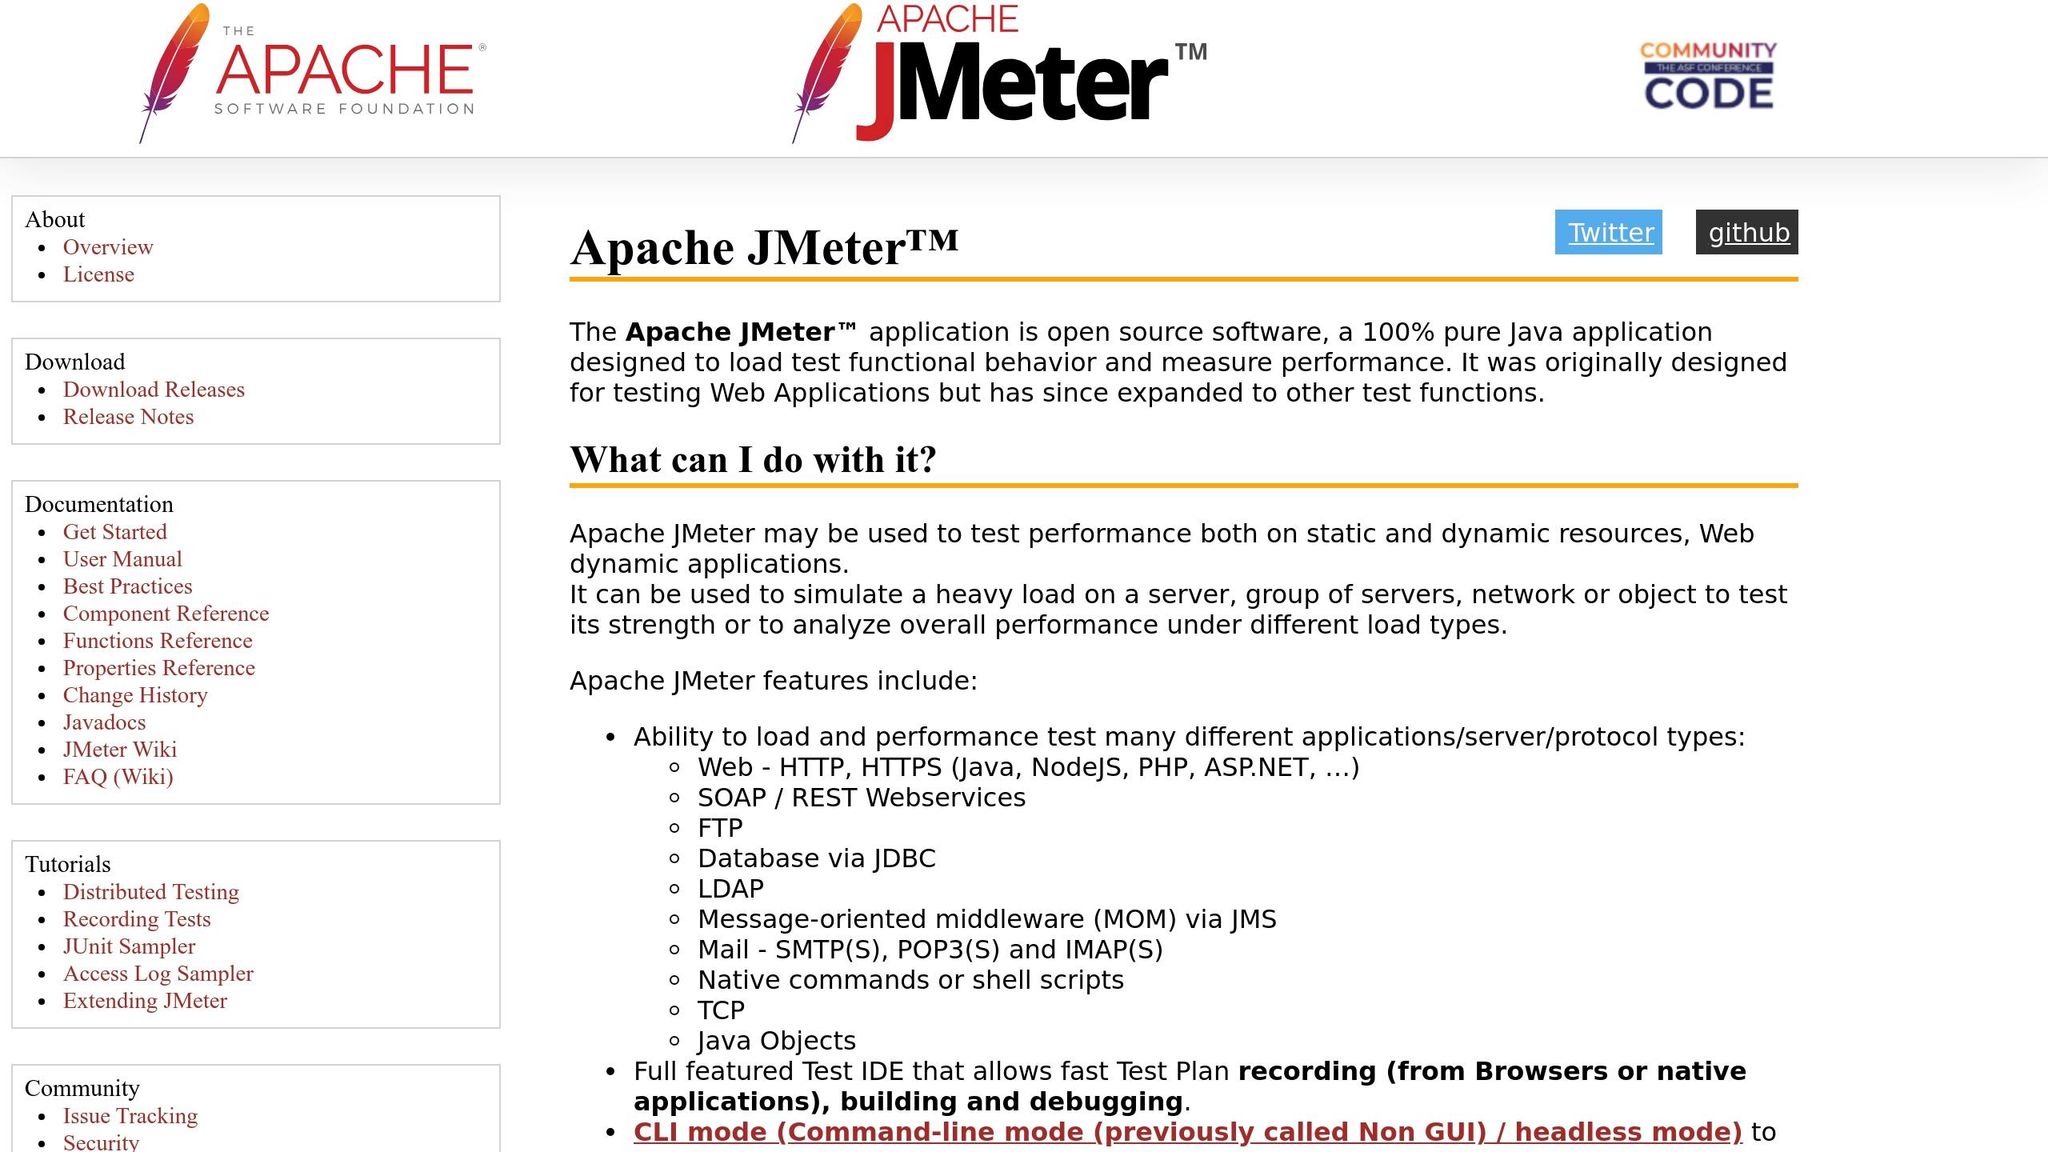
Apache JMeter is a widely used, open-source tool that's free to use. It operates at the protocol level, simulating server requests without rendering web pages, making it a great fit for low-code apps that rely on APIs like HTTP, HTTPS, SOAP/REST, or JDBC connections.
Its user-friendly GUI allows beginners to create tests by dragging and dropping components. For better performance, you can switch to CLI mode to save resources. JMeter follows a "one thread per virtual user" model, using about 1 MB of memory per user. A single instance typically supports 1,000 virtual users, but scaling beyond that requires distributing the load across multiple machines. However, one drawback is its inability to execute JavaScript embedded in HTML pages.
BlazeMeter
BlazeMeter builds on JMeter's foundation with added features like a no-code interface, a scriptless recorder, and enterprise-level CI/CD integration. It's perfect for handling massive traffic spikes, supporting up to 2 million virtual users across 56 global locations. This makes it ideal for testing scalability and performance under extreme conditions.
BlazeMeter seamlessly integrates with CI/CD pipelines, helping you catch performance issues before code merges. It also supports existing JMeter, Gatling, and k6 scripts, so there's no need to rewrite tests when transitioning to BlazeMeter. The platform offers a free tier for up to 50 virtual users, with paid plans starting at $149 per month for 1,000 concurrent users.
For teams that prefer a code-first approach, k6 might be a better fit.
k6
k6 is a tool designed with developers in mind. While it’s written in Go, test scripts are created in JavaScript (ES6), making it easy to integrate into modern development workflows. Known for its efficiency, k6 can handle 30,000–40,000 virtual users on a single instance, thanks to its lightweight goroutine model that uses just 100 KB of memory per user.
Recognized in the 2025 GigaOm Radar Report as a "Leader and Outperformer" for cloud performance testing, k6 has gained significant traction, with over 29,000 GitHub stars. It integrates seamlessly with observability platforms like Grafana, allowing teams to monitor load test results alongside real-time system metrics. The open-source version is free, while cloud-based scaling through Grafana Cloud k6 starts at $0.15 per virtual user-hour.
If your team is comfortable with JavaScript and prioritizes automation within CI/CD pipelines, k6 is an excellent choice. However, keep in mind that it lacks a graphical interface - everything is code-driven.
| Tool | Best For | Resource Efficiency | Scaling Approach | Pricing |
|---|---|---|---|---|
| Apache JMeter | API-heavy apps, protocol-level testing | ~1 MB per virtual user | Distributed setup across machines | Free |
| BlazeMeter | Large-scale traffic simulation | Cloud-managed | Automatic cloud scaling (2M+ users) | Free tier; $149/month for 1,000 users |
| k6 | CI/CD automation, modern apps | ~100 KB per virtual user | Single-machine or Kubernetes | Free; $0.15 per virtual user-hour |
Next, we’ll dive into a step-by-step guide to implementing these tools for effective load testing.
How to Approach Load Testing
A good load test mirrors critical user flows as closely as possible, focusing on the riskiest and most resource-heavy actions. The key to getting meaningful results lies in your approach. Start testing early, and don’t hesitate to push your system beyond its expected limits.
Start Load Testing Early in Development
Waiting until the last minute to test performance is a risky move. Incorporate load testing into your CI/CD pipeline, so it runs with every pull request or nightly build. This way, you can catch performance problems when they’re easier - and cheaper - to fix.
"Ideally, load testing should be a part of a regular regression run, as bug fixes can also affect the application's performance. If that isn't feasible, then it should at least be done after every major update." – Michael Tomara, QA Lead at TestFort
Starting early gives you a baseline for comparison. You’ll quickly notice if new features slow down response times or if a database query starts hogging memory. This is especially crucial for low-code apps, where abstraction layers can mask performance issues until they snowball. Once you’ve established these baselines, you can expand your testing to see how your system handles more extreme conditions.
Test Beyond Expected Peak Loads
After you’ve set your initial benchmarks, it’s time to push your app further. Maybe your system handles 1,000 users seamlessly - but what happens when 1,500 log in at once? Testing beyond anticipated peaks helps identify bottlenecks before they become production headaches.
"A load test that's too small gives you false confidence. Everything looks green in your dashboards, but when traffic surges in production, the cracks appear." – LoadView
To prepare for unexpected spikes, add safety margins to your tests - 10%, 25%, 50%, or even doubling your expected user load. Use ramping test patterns that gradually increase the number of virtual users until the system breaks, rather than jumping straight to maximum load. Keep in mind, scalability isn’t always linear - performance can drop sharply as load increases.
Simulate Real User Behavior
Testing with uniform, rapid-fire requests won’t show how real users interact with your app. Real users pause between actions, follow different workflows, and use unique credentials. Without accounting for these behaviors, your results won’t reflect real-world performance.
For realistic results, include 1–3 second pauses to mimic natural user interactions.
"Unrealistically fast 'users' might expose errors a real user would never see, so it's worth building in sleeps or 'think time' between actions." – Lars Holmberg, Performance Testing Expert at Locust.cloud
Make sure virtual users operate with distinct credentials, product IDs, and IP addresses. This prevents artificially high cache hit rates that might make your app seem faster than it actually is.
Also, balance tasks based on actual user behavior. For example, if 90% of users browse and only 10% complete purchases, your test should reflect that ratio. And don’t stop at checking for "200 OK" status codes - confirm that responses include valid data, like an order ID. Low-code platforms, in particular, can return success codes even when processes fail internally. Realistic simulations like this can uncover issues that only appear under real-world conditions.
How to Load Test Low-Code Apps: Step-by-Step
To effectively load test low-code apps, the process can be broken down into three key phases: defining what you’re testing, preparing your environment, and running the tests. Each step aims to simulate realistic conditions to uncover performance issues.
Define Test Scenarios and Baselines
Start by identifying the critical user journeys, such as signing up, logging in, making payments, or navigating dashboards. For low-code platforms like Bubble, workflows tied to the database and backend often become bottlenecks, so these should be a priority when designing test scenarios. The abstraction layers in low-code platforms make it essential to design scenarios that can expose hidden performance issues.
Set measurable targets for key metrics. For example, you might aim for 95% of requests to complete in under 500 ms with an error rate below 1%. Another example could be: "The checkout endpoint must respond within 300 ms at the 95th percentile with an error rate under 0.05% when handling 5,000 concurrent users".
"The difference between a useful load test and a waste of time comes down to scenario design." – Nawaz Dhandala, Author, OneUptime
Design scenarios that replicate real-world usage, such as concurrent users browsing and checking out, rather than testing isolated workflows. Document baseline results so you can measure improvements or regressions after future updates or optimizations.
Once you’ve defined your scenarios and targets, the next step is to create a test environment that mirrors production.
Prepare Your Test Environment
Your test environment should closely match your production setup, including hardware (CPU, memory, disk space), software versions, and network configurations. This step is particularly important for low-code platforms due to their reliance on backend services and abstraction layers.
Use anonymized datasets that reflect production volumes. A small database with 100 rows won’t expose the same issues as one with 10 million rows. Start with a smoke test - run a minimal load (e.g., fewer than five virtual users) for a few minutes to ensure your scripts and environment are functioning properly before scaling up.
It’s also critical to test on real browsers and devices, as differences in rendering can impact performance. Optimize your application to fetch only the necessary data - like the latest 10 records - instead of pulling entire datasets, which can help prevent payload bottlenecks.
With your environment ready, you can now move on to running the tests.
Run Tests and Collect Data
Begin with a small number of virtual users to establish a baseline, then gradually increase the load to determine the point at which performance degrades. Monitor metrics across the stack, including client-side response times, server CPU and memory usage, database query performance, and connection pool activity.
Focus on percentiles like P95 and P99 instead of averages, as averages can hide the slowest-performing requests. For example, Amazon discovered that every additional 100 ms of latency resulted in a 1% drop in sales. Percentiles provide a clearer picture of the worst-case experiences for users.
Set up automated alerts to flag performance issues if your Service Level Objectives (SLOs) aren’t met - such as 95% of requests completing in under 200 ms. Share test results on team dashboards like Grafana to keep everyone informed about performance trends. After fixing major bottlenecks, re-run the tests to confirm improvements and identify any remaining issues.
Analyzing Results and Improving Performance
Using the performance metrics mentioned earlier, you can compare client-side metrics with server resource usage to identify where slowdowns occur. It's better to focus on percentiles like the 90th, 95th, or 99th (P90/P95/P99) instead of averages. Why? Averages can mask the worst-case scenarios that a portion of users might experience.
Find Performance Bottlenecks in Test Data
Start by reviewing client-side metrics such as response times and error rates alongside server-side data like CPU usage, memory, and database throughput. If throughput levels off or drops as the number of concurrent users increases, you've likely hit a bottleneck. For example, high error rates on specific API calls - like database-intensive "add" or "get" requests - can indicate backend or database issues, especially when other endpoints remain stable.
For low-code apps, don’t just rely on status codes like "200 OK." Always validate the response content. A "200 OK" might still carry an error message. Pay attention to database-specific signals, such as "Normalized RU Consumption" for Cosmos DB or signs of connection pool exhaustion.
"The goal is not just to know if the test passed, but to understand system behavior under load and identify optimization opportunities before they become production problems." – Nawaz Dhandala, OneUptime
Once bottlenecks are identified, the next step is to implement targeted fixes.
Make Changes Based on Test Results
After pinpointing performance issues, take action. For instance, in August 2025, a Node.js application using Azure Cosmos DB faced high response times for "add" and "get" requests during load testing. Server-side metrics showed the database was maxed out at 100% "Normalized RU Consumption" with a limit of 400 RUs. Increasing the provisioned throughput to 1,200 RUs brought resource usage back under control and improved response times.
Some common solutions include:
- Optimizing data architecture: Store pre-calculated values and update them only when necessary.
- Simplifying queries: Remove unnecessary nesting and use constraints to fetch only the latest records instead of entire datasets.
- Shifting heavy processing: Move intensive tasks from the client-side to the backend to maintain responsiveness under load.
If server CPU or memory usage exceeds 90% consistently, consider adding more servers or implementing a load balancer. For browser-side issues like slow rendering, fine-tune HTML, JavaScript, and CSS execution. After applying fixes, re-run tests to confirm improvements and ensure no new bottlenecks emerge.
Adding Load Testing to CI/CD Pipelines
Once you've addressed performance issues, it's crucial to ensure they don't creep back in. By automating load testing in your CI/CD pipeline, you can catch performance regressions early - before they hit production. This not only prevents disruptions but also cuts down on expensive fixes later on. To integrate load testing into your CI/CD workflow, run tests in headless mode using CLI parameters for a smooth, automated process.
This approach establishes a solid foundation for embedding quality controls directly into your deployment pipeline.
Using Threshold-Based Quality Gates
Automated load testing relies on threshold-based quality gates to enforce performance standards. For example, you might set criteria like keeping the 95th percentile (P95) response time under 500 ms and maintaining error rates below 1%. If these thresholds aren't met, the system automatically blocks the deployment. Tools like k6 and Locust make this process seamless by returning non-zero exit codes when thresholds fail - k6, for instance, uses exit code 99, while Locust has an --exit-code-on-error=1 flag for similar functionality.
"Integrating k6 into your CI/CD pipeline establishes performance testing as a first-class citizen in your deployment process." – Nawaz Dhandala, OneUptime
Real-World Examples
Several major companies have successfully adopted these practices. Netflix, for instance, runs load tests early in its CI/CD pipeline to catch performance issues in new microservices before they can affect production. Similarly, Olo has integrated k6 with Grafana, allowing their engineering team to visualize test results in real time. This setup helps them quickly identify and address performance regressions during live API deployments.
Automating Script Management and Configuration
To streamline your CI/CD process, automate the management of load test scripts and environment configurations. Store scripts - like k6 JavaScript files or Locust Python files - alongside your application code. This keeps your tests aligned with application updates and ensures consistency with earlier test results. Use environment variables to configure target URLs, user counts, and authentication tokens, making it easy to adapt tests for different environments. For cloud-hosted low-code apps, secure authentication through service principals, API keys, or OpenID Connect (OIDC).
For practical implementation, consider running quick one-minute smoke tests on every pull request to validate changes rapidly. Reserve more comprehensive load or soak tests for merges into the main branch or major releases. This balance ensures both efficiency and thoroughness in maintaining application performance.
Conclusion
Effective load testing lays the groundwork for scalable low-code applications. It’s not just about keeping systems running; it’s about protecting revenue, maintaining customer trust, and preserving your brand’s reputation. For low-code platforms, where abstraction layers can sometimes hide performance bottlenecks, regular load testing becomes even more crucial.
Start early, and make load testing a core part of your development process. As Michael Tomara suggests, integrating load testing into your CI/CD pipeline allows you to catch performance regressions before they ever impact production. Focus on actionable metrics like P95 response times, error rates, and resource usage - these provide a clearer picture than simple averages. Set performance budgets, such as ensuring 95% of requests complete in under 500ms, and use automated quality gates to block deployments that fail to meet these thresholds. Push beyond expected peak loads to identify breaking points and prepare for worst-case scenarios.
Load testing isn’t just about avoiding downtime. It ensures your low-code applications can scale with growing user demand, prevents unnecessary infrastructure costs from over-provisioning, and sustains the seamless user experience that keeps customers engaged. With slow applications driving high abandonment rates, performance testing becomes a business imperative in today’s competitive environment. These strategies help ensure your low-code app stays fast and reliable as it evolves.
Make load testing a continuous effort. Automating these tests lets your performance strategy grow alongside your application, adapting to every update and change.
FAQs
What’s the best first load test to run on a low-code app?
When starting with load testing, the best approach is to run a baseline load test. This test simulates typical user activity, such as browsing, submitting forms, or completing a checkout process, to see how the system performs under normal conditions. It's essential to run this test in an environment that closely matches your production setup - this ensures accurate results without causing disruptions to your actual operations.
The goal? To spot bottlenecks, measure response times, and set performance benchmarks. These benchmarks become the foundation for fine-tuning and scaling efforts as you dive deeper into testing.
How do I set realistic P95 response-time targets for my app?
To establish practical P95 response-time goals, start by evaluating your app's performance during load testing under typical user conditions. Focus on identifying the response time that 95% of user requests achieve or exceed. This ensures that the majority of users enjoy a smooth experience. Use these findings to align with industry benchmarks or user expectations - like targeting P95 response times of less than 2 seconds. As your app grows and changes, revisit and adjust these targets to maintain performance standards.
How can I load test third-party API dependencies safely?
To ensure safe load testing of third-party API dependencies, it's crucial to use tools that provide sandbox or staging environments. This approach helps you avoid any disruptions to live systems. Techniques such as shadow testing are particularly useful, as they allow you to simulate real traffic without interfering with production environments.
Keep your testing environment isolated to maintain control and prevent unintended consequences. Additionally, implement throttling or pacing mechanisms to ensure that your tests don’t overwhelm the third-party services. For added efficiency, consider using open-source low-code tools. These tools can automate the testing process and help minimize potential coding errors.